HaDeX customized ggplot theme
HaDeXify.RdThis function HaDeXifies plot. It adds HaDeX logo and ggplot theme.
Value
a ggplot object.
Details
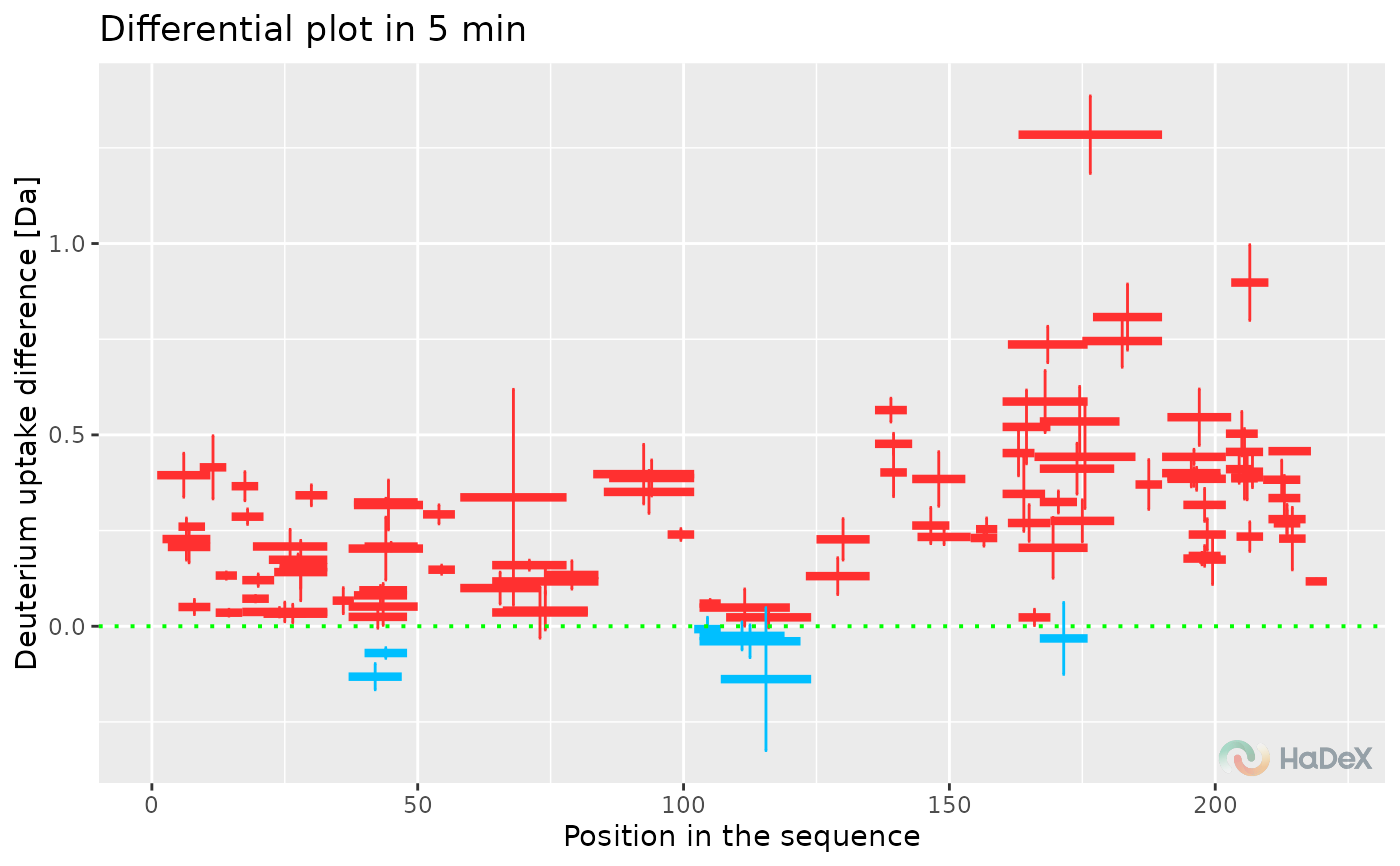
Function adds the logo of HaDeX package in the left down corner of the plot and the HaDeX theme.
Examples
diff_uptake_dat <- create_diff_uptake_dataset(alpha_dat)
HaDeXify(plot_differential(diff_uptake_dat))
#> Warning: Using `size` aesthetic for lines was deprecated in ggplot2 3.4.0.
#> ℹ Please use `linewidth` instead.
#> ℹ The deprecated feature was likely used in the HaDeX2 package.
#>   Please report the issue to the authors.