Data aggregation
transformation.RmdThe aggregation of the hydrogen-deuterium exchange experimental data is complex. This article describes the process step by step for a better understanding of the data transformation.
0.1 Aggregation of the data - visualization
Let’s see how the data is transformed. We will use the example alpha_dat file from the HaDeX package and focus on just one peptide - “GFGDLKSPAGL” in the state “Alpha”. The measurement was made for time point 1 min.
Below is shown the original and not aggregated data for chosen peptide.
## Protein Start End Sequence Modification MaxUptake MHP State
## <char> <int> <int> <char> <lgcl> <int> <num> <char>
## 1: db_eEF1Ba 1 11 GFGDLKSPAGL NA 9 1061.563 Alpha_KSCN
## 2: db_eEF1Ba 1 11 GFGDLKSPAGL NA 9 1061.563 Alpha_KSCN
## 3: db_eEF1Ba 1 11 GFGDLKSPAGL NA 9 1061.563 Alpha_KSCN
## 4: db_eEF1Ba 1 11 GFGDLKSPAGL NA 9 1061.563 Alpha_KSCN
## 5: db_eEF1Ba 1 11 GFGDLKSPAGL NA 9 1061.563 Alpha_KSCN
## 6: db_eEF1Ba 1 11 GFGDLKSPAGL NA 9 1061.563 Alpha_KSCN
## Exposure File z Inten Center
## <num> <char> <int> <int> <num>
## 1: 1 Tania_161108_1eEF1Ba_KSCN_1min 1 48304 1064.9813
## 2: 1 Tania_161108_1eEF1Ba_KSCN_1min 2 430554 533.0463
## 3: 1 Tania_161108_2eEF1Ba_KSCN_1min 1 48450 1065.1294
## 4: 1 Tania_161108_2eEF1Ba_KSCN_1min 2 456787 532.9971
## 5: 1 Tania_161108_3eEF1Ba_KSCN_1min 1 53200 1065.0681
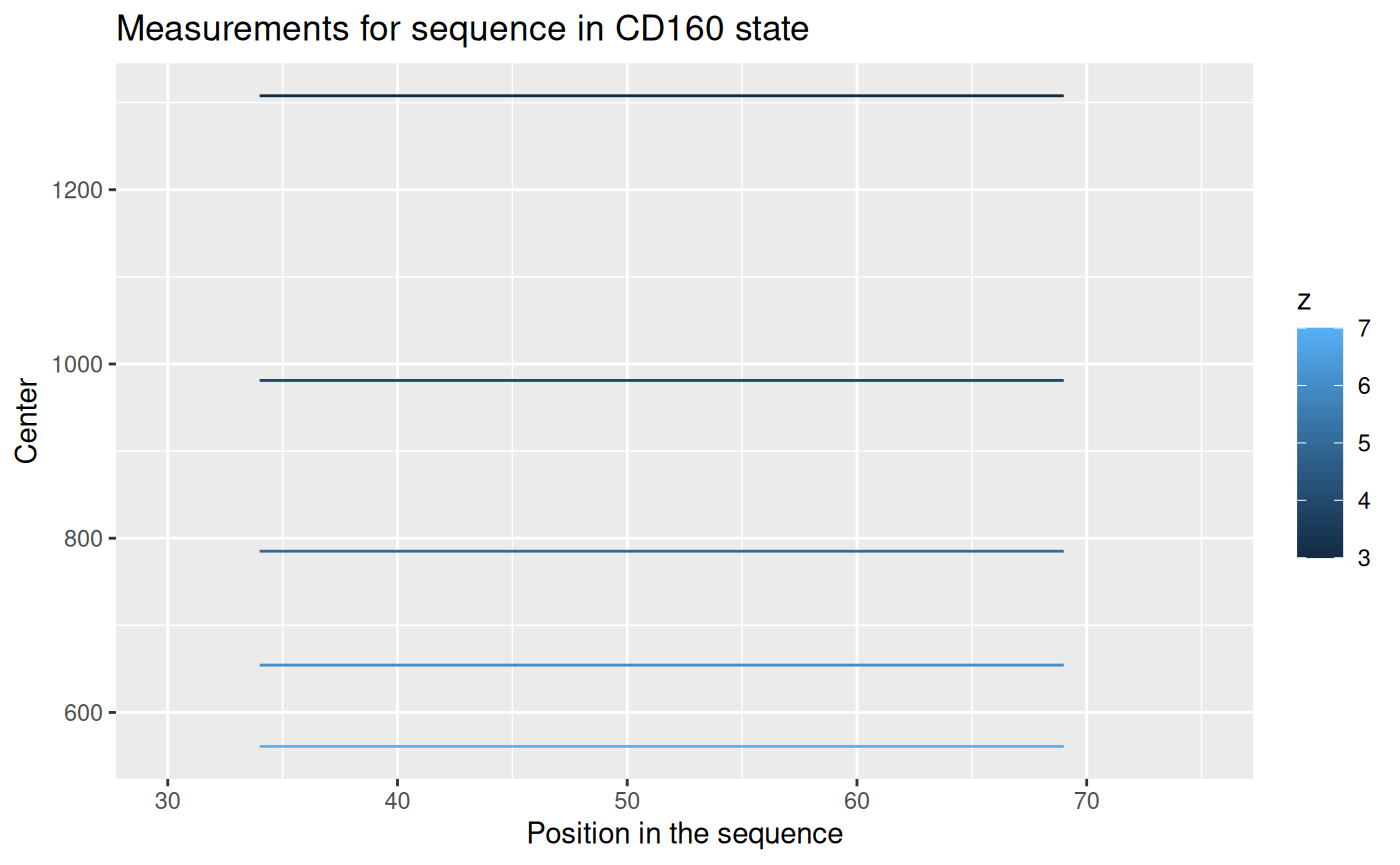
## 6: 1 Tania_161108_3eEF1Ba_KSCN_1min 2 469153 533.1101As we can see from the \(File\) column, there are four replicates of the experiment. Each measurement of a replicate provide values for different possible charge values for each peptide. The result of a measurement is in column \(Center\) - this is a geometrical centroid of an isotopic envelope - the product of the measurement from a mass spectrometer.
Let’s take a look for values for each replicate.
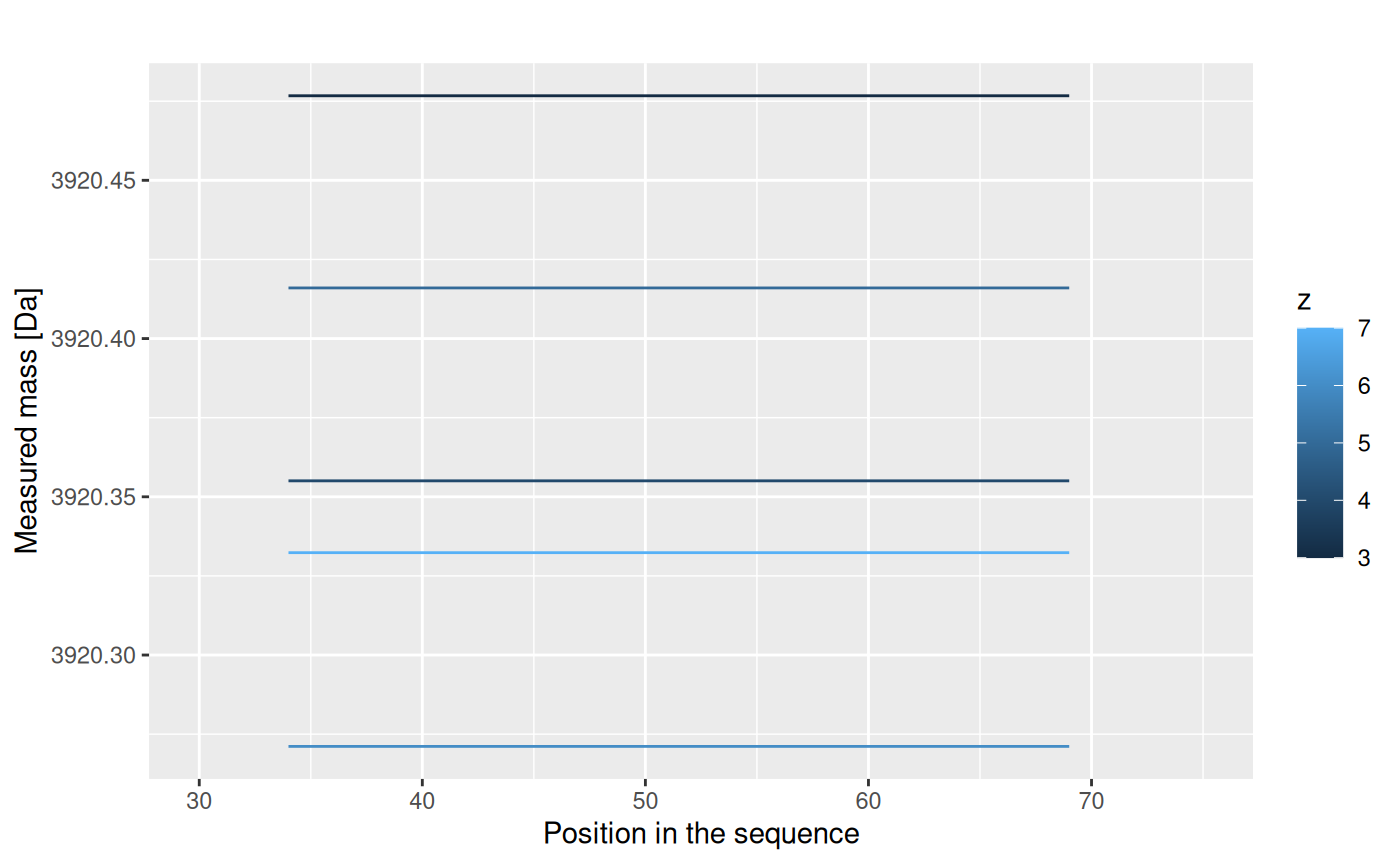
The centroid values for different charge values are not useful. We have to transform it to the mass values, according to an equation:
\[ aggMass = z*(Center - protonMass)\] The results are shown below.
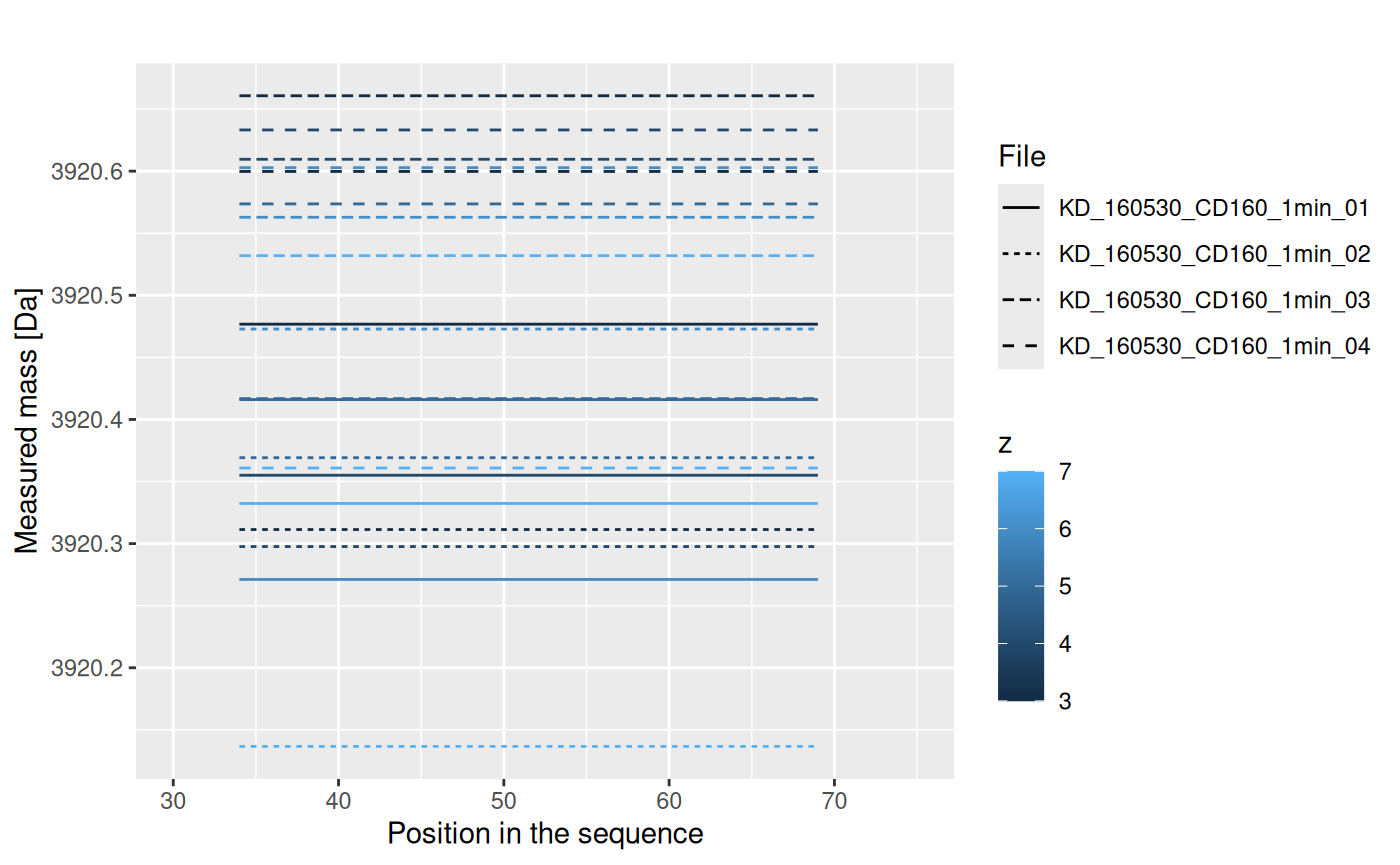
This results are just for one repetition. We have four of them:
Values from each replicate are aggregated into one value, using weighted mean (with intensity value as weight):
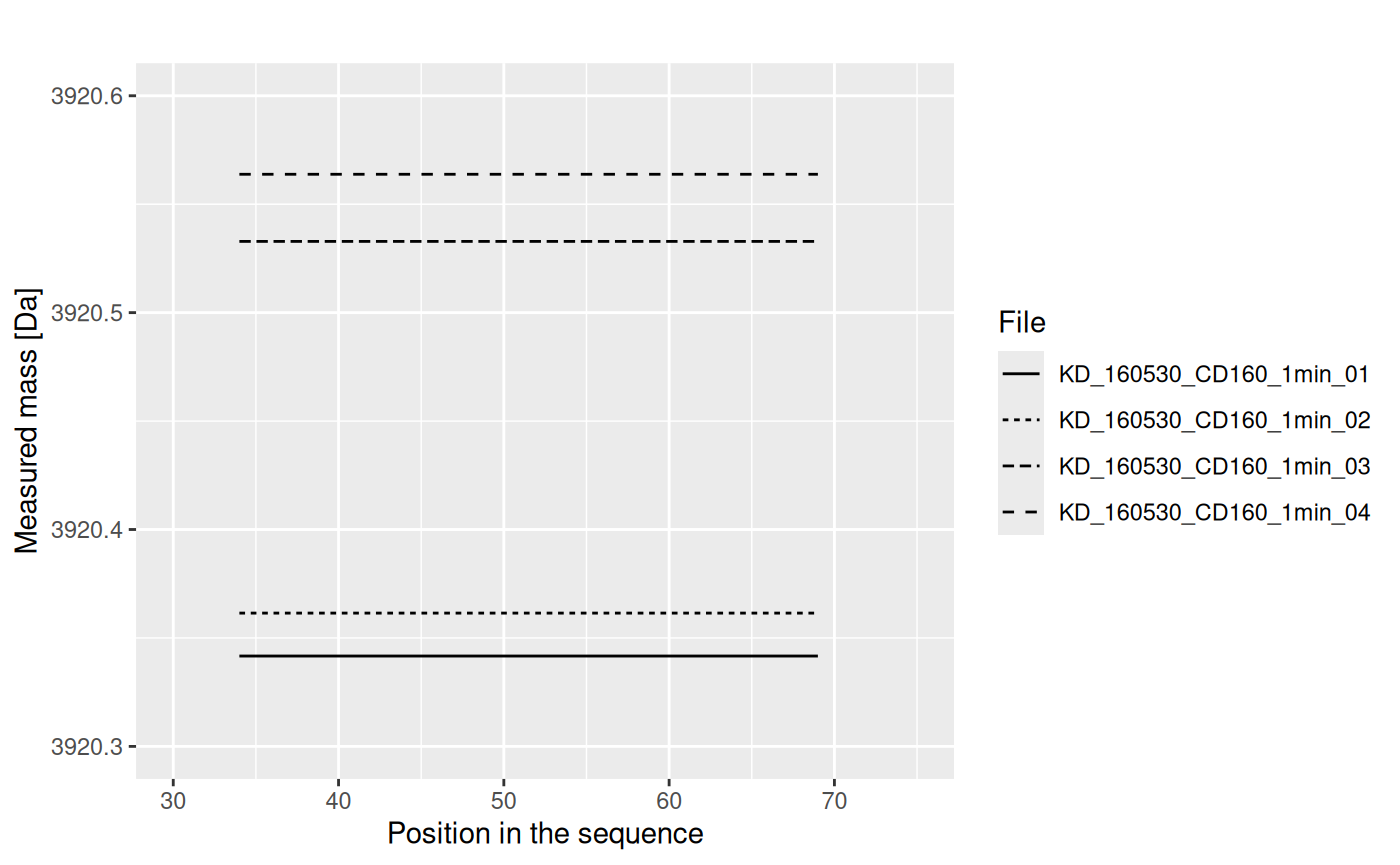
The results from replicates are aggregated into the final result (mean), and the uncertainty (standard deviation of the mean) is calculated.
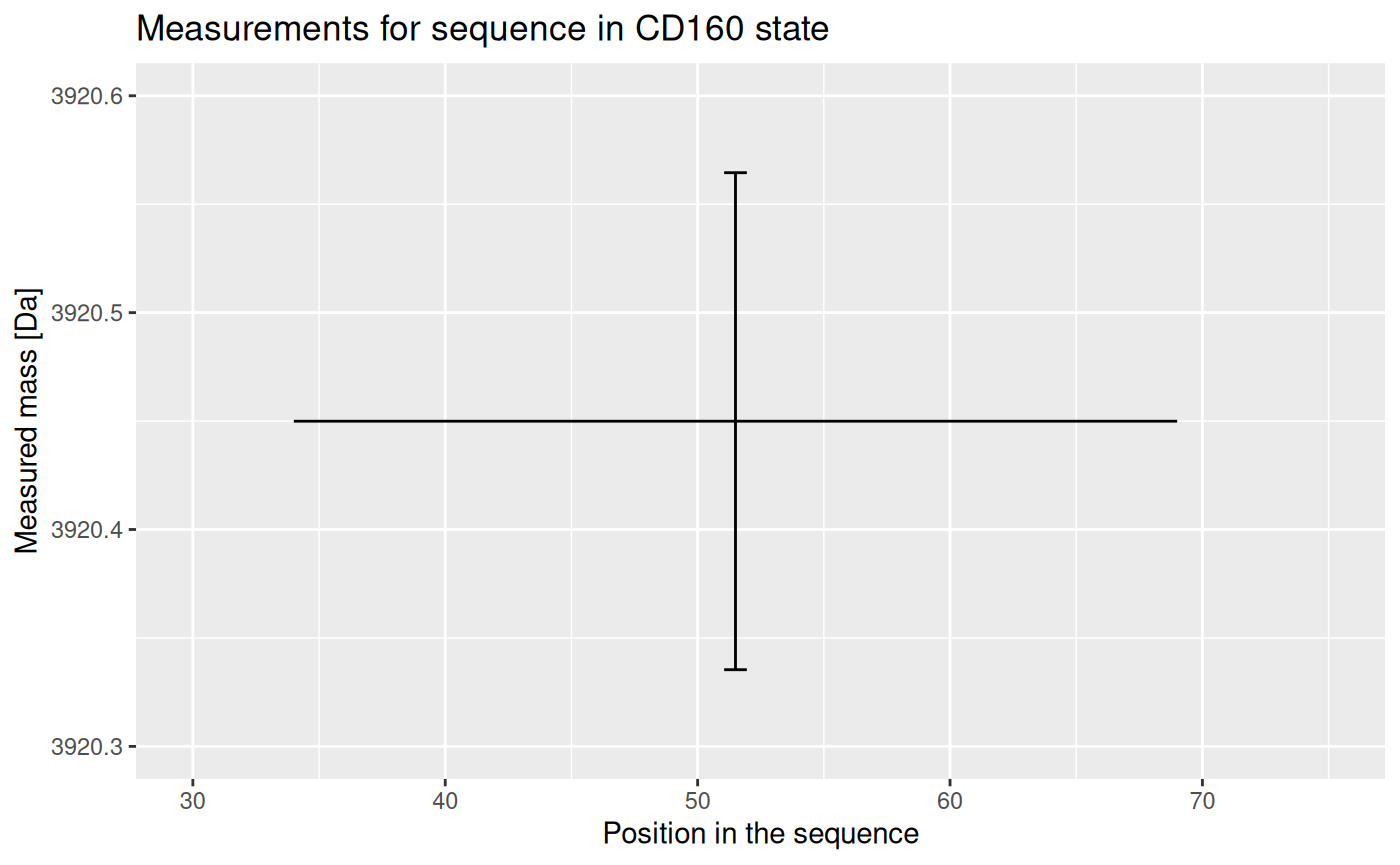
Now we have the mass value for chosen peptide in the chosen state, measured in the chosen time point. This calculation is done for every other peptide, and these values of mass and uncertainty are used in the calculation of deuterium uptake, as described in the vignette("datafiles") article.