Skip to contents

Convention

Purpose of groups of functions in the package:

  • calculate_* - calculates one specific value. e.q. deuterium uptake values for specific time point.
  • create_* - creates a dataset for set of values e.q. multiple time points.
  • plot_* - plots a visualization of provided data, accepts calculate_* and create_* outputs.
  • show_* - subsets the dataset to show specific values, accepts calculate_* and create_* outputs.

Variables:

  • deut_uptake - deuterium uptake [Da]
  • frac_deut_uptake - fractional deuterium uptake [%]
  • theo_deut_uptake - theoretical deuterium uptake [Da]
  • theo_frac_deut_uptake - theoretical fractional deuterium uptake [%]
  • diff_deut_uptake - differential deuterium uptake [Da]
  • frac_diff_deut_uptake - theoretical differential fractional deuterium uptake [%]
  • theo_diff_deut_uptake - differential deuterium uptake [Da]
  • theo_frac_diff_deut_uptake - theoretical differential fractional deuterium uptake [%]

Example of use

Read data file

dat <- read_hdx(system.file(package = "HaDeX", "HaDeX/data/KD_180110_CD160_HVEM.csv"))
## [1] ""
# dat %>%
#   calculate_state_uptake() %>%
#   plot_state_comparison()
dat %>%
  calculate_peptide_kinetics(protein = "db_CD160",
                             sequence = "INITSSASQEGTRLN",
                             start = 1,
                             end = 15,
                             states = c("CD160", "CD160_HVEM"),
                             time_0 = 0.001, time_100 = 1440) %>%
  plot_uptake_curve(fractional = TRUE)

dat %>%
  calculate_peptide_kinetics(protein = "db_CD160",
                             sequence = "INITSSASQEGTRLN",
                             start = 1,
                             end = 15,
                             states = c("CD160", "CD160_HVEM"),
                             time_0 = 0.001, time_100 = 1440) %>%
  show_uptake_data(fractional = TRUE)
##      Protein        Sequence    ID Modification      State Start   End Exposure
##       <char>          <char> <int>       <lgcl>     <char> <int> <int>    <num>
##  1: db_CD160 INITSSASQEGTRLN     1           NA      CD160     1    15    0.167
##  2: db_CD160 INITSSASQEGTRLN     1           NA      CD160     1    15    1.000
##  3: db_CD160 INITSSASQEGTRLN     1           NA      CD160     1    15    5.000
##  4: db_CD160 INITSSASQEGTRLN     1           NA      CD160     1    15   25.000
##  5: db_CD160 INITSSASQEGTRLN     1           NA      CD160     1    15  120.000
##  6: db_CD160 INITSSASQEGTRLN     1           NA CD160_HVEM     1    15    0.167
##  7: db_CD160 INITSSASQEGTRLN     1           NA CD160_HVEM     1    15    1.000
##  8: db_CD160 INITSSASQEGTRLN     1           NA CD160_HVEM     1    15    5.000
##  9: db_CD160 INITSSASQEGTRLN     1           NA CD160_HVEM     1    15   25.000
## 10: db_CD160 INITSSASQEGTRLN     1           NA CD160_HVEM     1    15  120.000
##     Frac DU [%] U(Frac DU) [%]
##           <num>          <num>
##  1:     76.8561         0.3832
##  2:     84.1962         0.6111
##  3:     87.5333         0.5943
##  4:     93.1959         0.5786
##  5:     95.5038         0.8333
##  6:     74.3584         0.6689
##  7:     81.5377         0.9895
##  8:     82.8900         0.8820
##  9:     87.6782         0.7086
## 10:     95.1868         0.7919

Different forms of visualization

Create data frame with uptake values for state in all time points:

uptake_dat <- create_state_uptake_dataset(dat)

Butterfly:

plot_butterfly(uptake_dat)
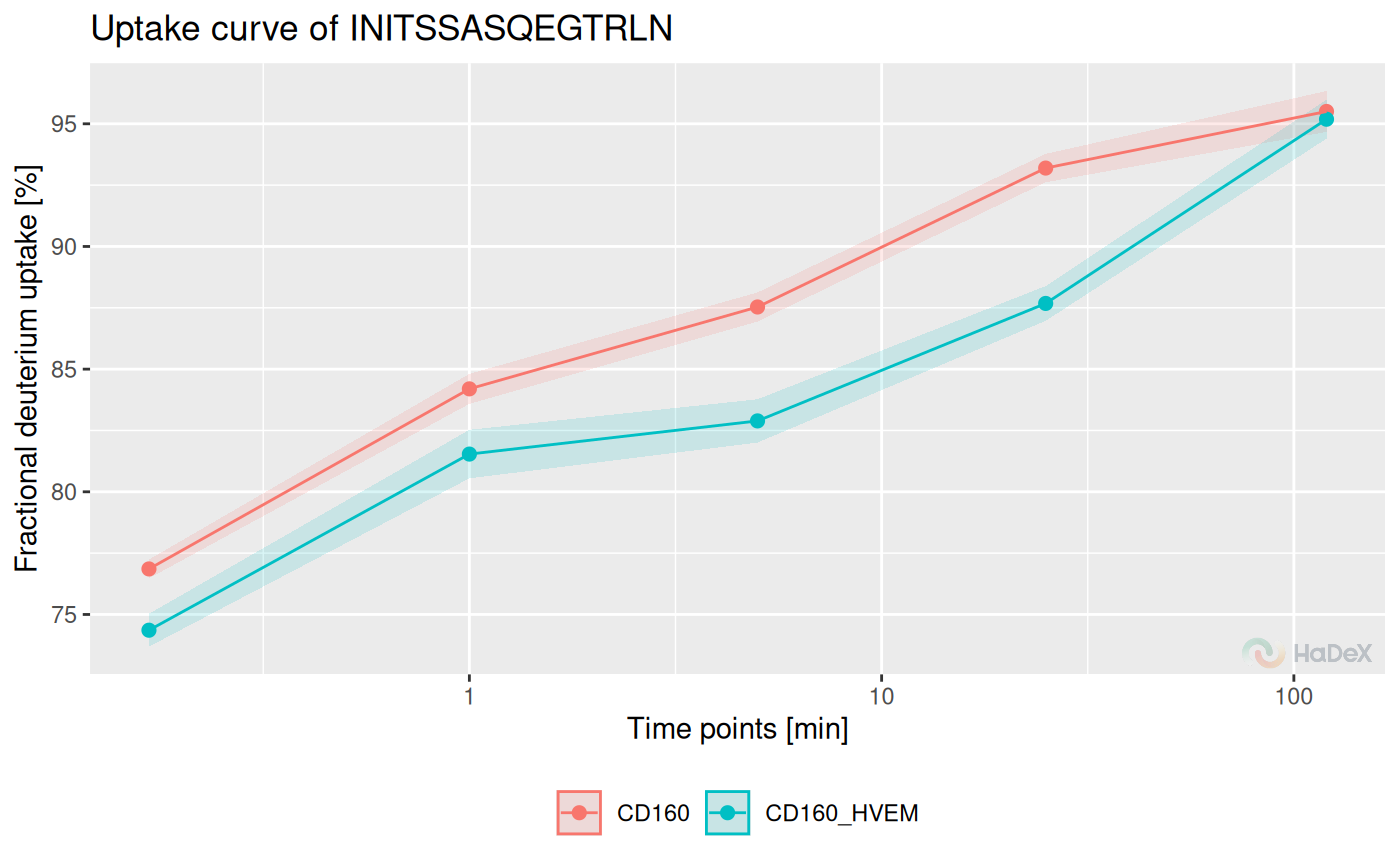
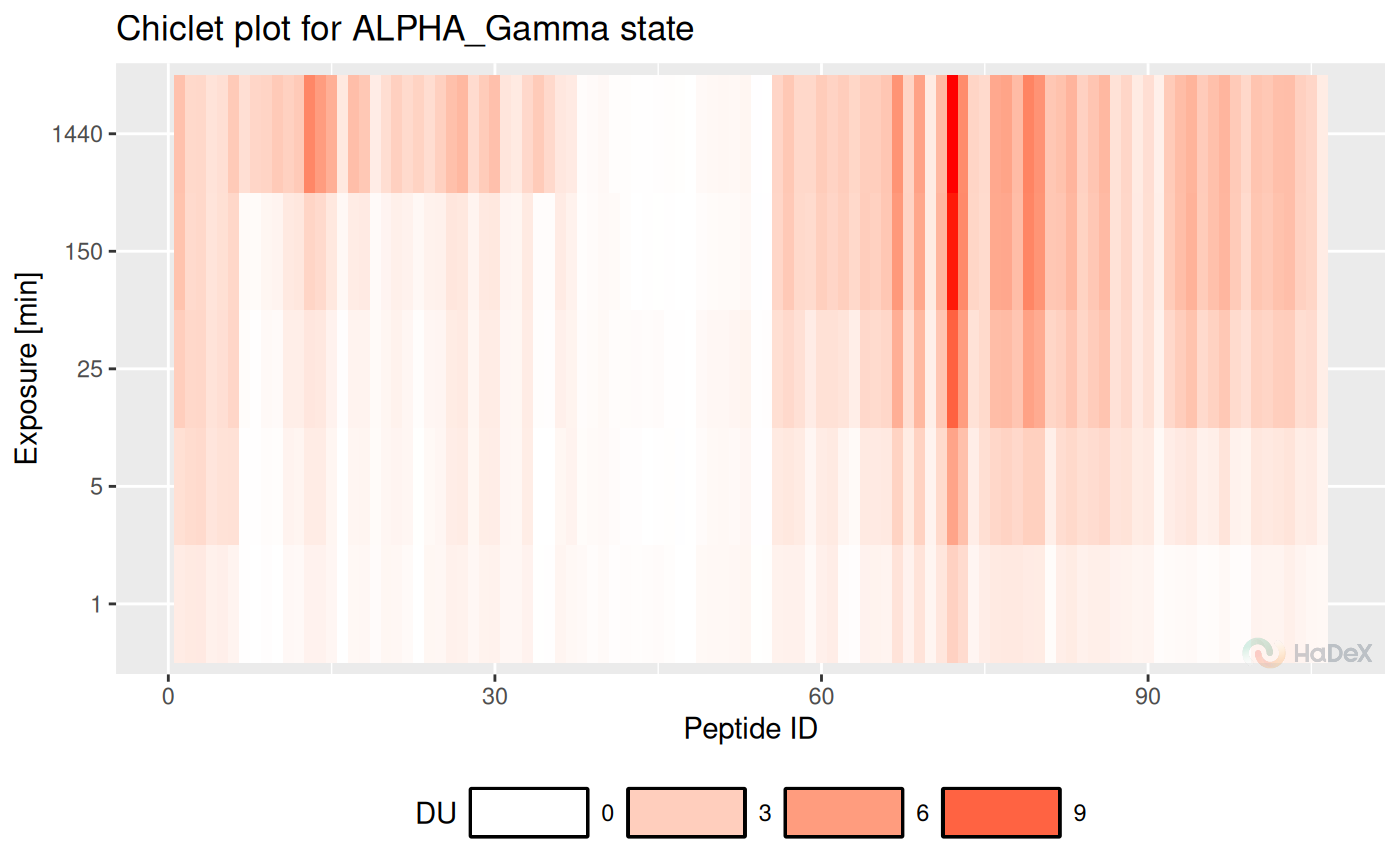
Chiclet:

plot_chiclet(uptake_dat)