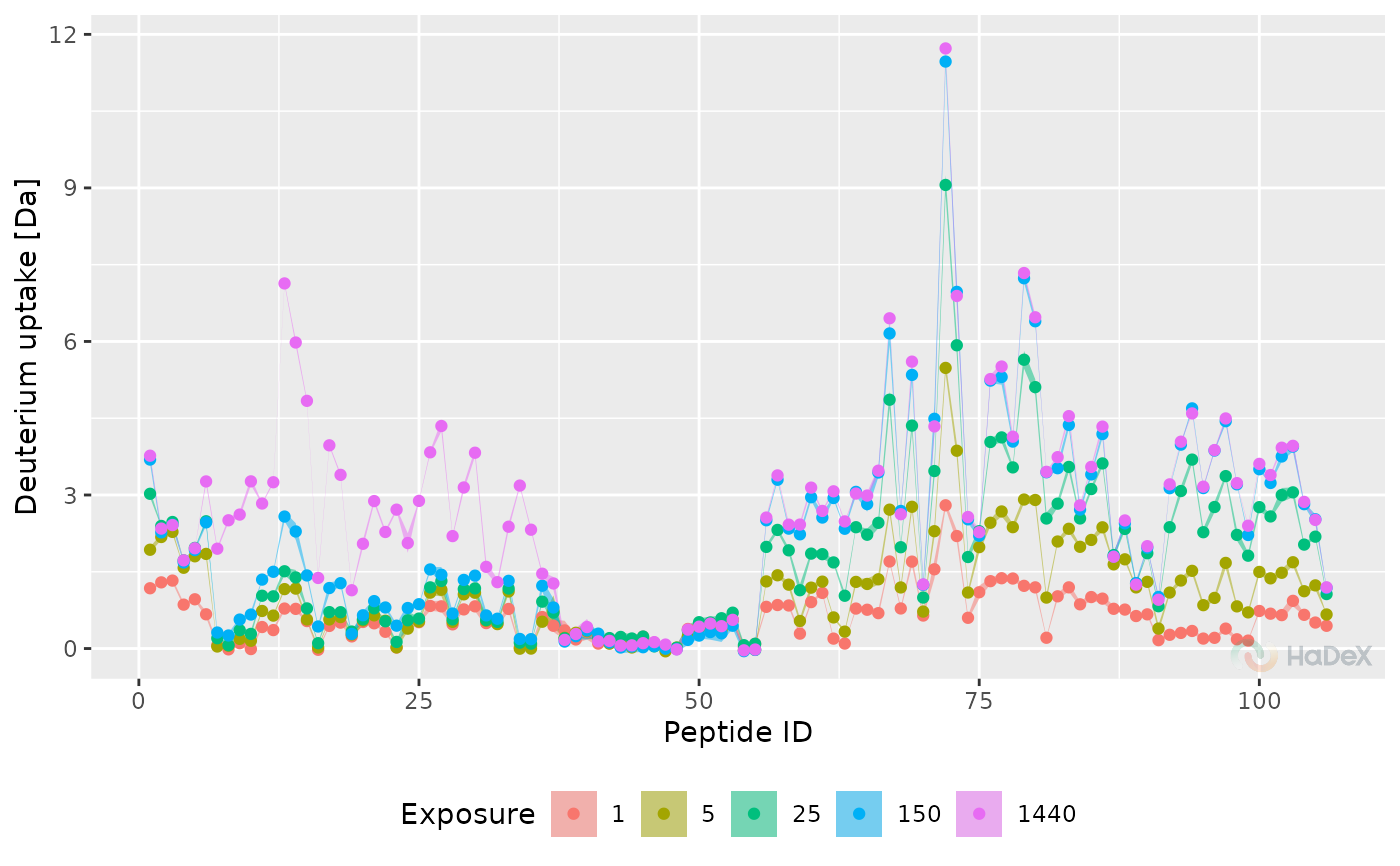
Butterfly deuterium uptake plot
plot_butterfly.RdButterfly plot of deuterium uptake values in time for one biological state.
Usage
plot_butterfly(
  uptake_dat,
  theoretical = FALSE,
  fractional = FALSE,
  uncertainty_type = "ribbon",
  interactive = getOption("hadex_use_interactive_plots")
)
Arguments
- uptake_dat
data produced by
create_state_uptake_datasetfunction.- theoretical
logical, determines if values are theoretical.- fractional
logical, determines if values are fractional.- uncertainty_type
type of presenting uncertainty, possible values: "ribbon", "bars" or "bars + line".
- interactive
logical, whether plot should have an interactive layer created with with ggiraph, which would add tooltips to the plot in an interactive display (HTML/Markdown documents or shiny app).
Value
a ggplot object.
Details
Function plot_butterfly generates butterfly plot
based on provided data and parameters. On X-axis there is peptide ID. On the Y-axis
there is deuterium uptake in chosen form. Data from multiple time points of
measurement is presented.
Examples
state_uptake_dat <- create_state_uptake_dataset(alpha_dat)
plot_butterfly(state_uptake_dat)