Differential plot
plot_differential.RdWoods plot of differential deuterium uptake values between two biological states in time point.
Usage
plot_differential(
  diff_uptake_dat = NULL,
  diff_p_uptake_dat = NULL,
  skip_amino = 0,
  time_t = NULL,
  theoretical = FALSE,
  fractional = FALSE,
  show_houde_interval = FALSE,
  hide_houde_insignificant = FALSE,
  show_tstud_confidence = FALSE,
  hide_tstud_insignificant = FALSE,
  confidence_level = 0.98,
  all_times = FALSE,
  line_size = 1.5,
  interactive = getOption("hadex_use_interactive_plots")
)
Arguments
- diff_uptake_dat
produced by
calculate_diff_uptakeorcreate_diff_uptake_datasetfunction.- diff_p_uptake_dat
produced by
create_p_diff_uptake_datasetfunction.- skip_amino
integer, indicator how many amino acids from the N-terminus should be omitted- time_t
time point of measurement, if only one should be displayed on the plot.
- theoretical
logical, determines if values are theoretical.- fractional
logical, determines if values are fractional.- show_houde_interval
logical, determines if houde interval is shown.- hide_houde_insignificant
logical, determines if statistically insignificant values using Houde test are hidden on the plot.- show_tstud_confidence
logical, determines if t-Student test validity is shown.- hide_tstud_insignificant
logical, determines if statistically insignificant values using t-Student test are hidden on the plot.- confidence_level
confidence level for the test, from range [0, 1].
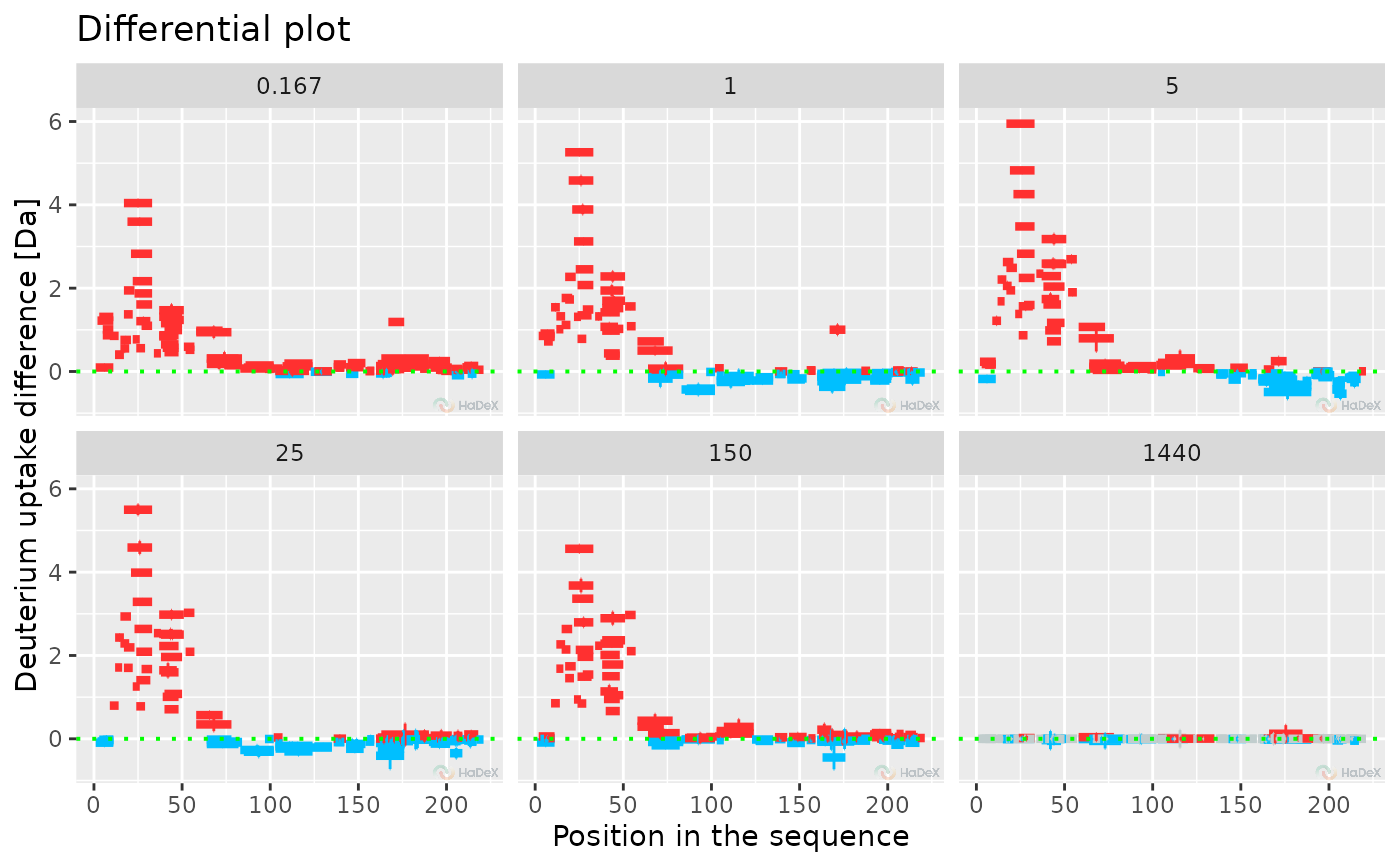
- all_times
logical, determines if all the time points from the supplied data should be displayed on the plots next to each other.- line_size
line size of the lines displayed on the plot.
- interactive
logical, whether plot should have an interactive layer created with with ggiraph, which would add tooltips to the plot in an interactive display (HTML/Markdown documents or shiny app).
Details
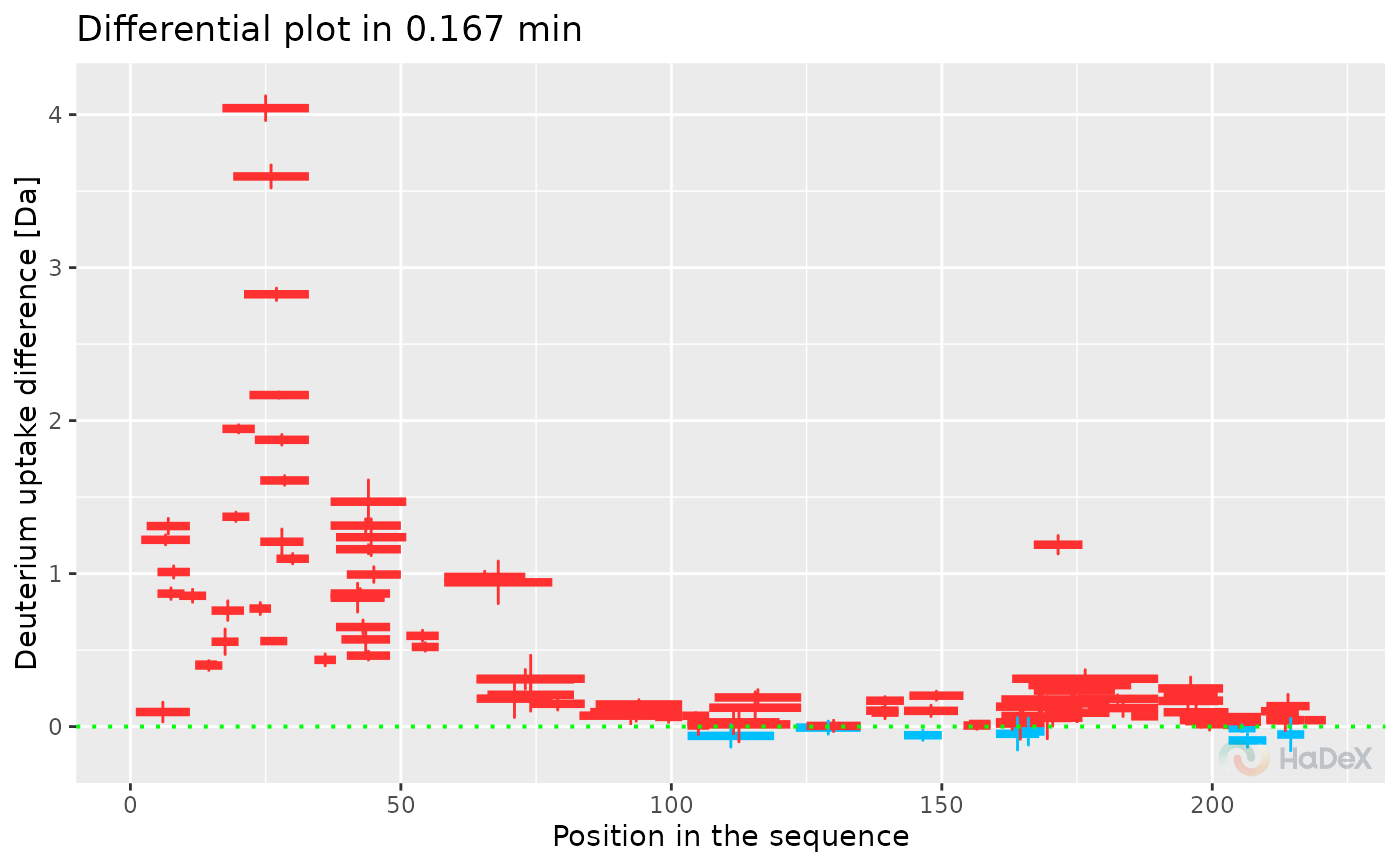
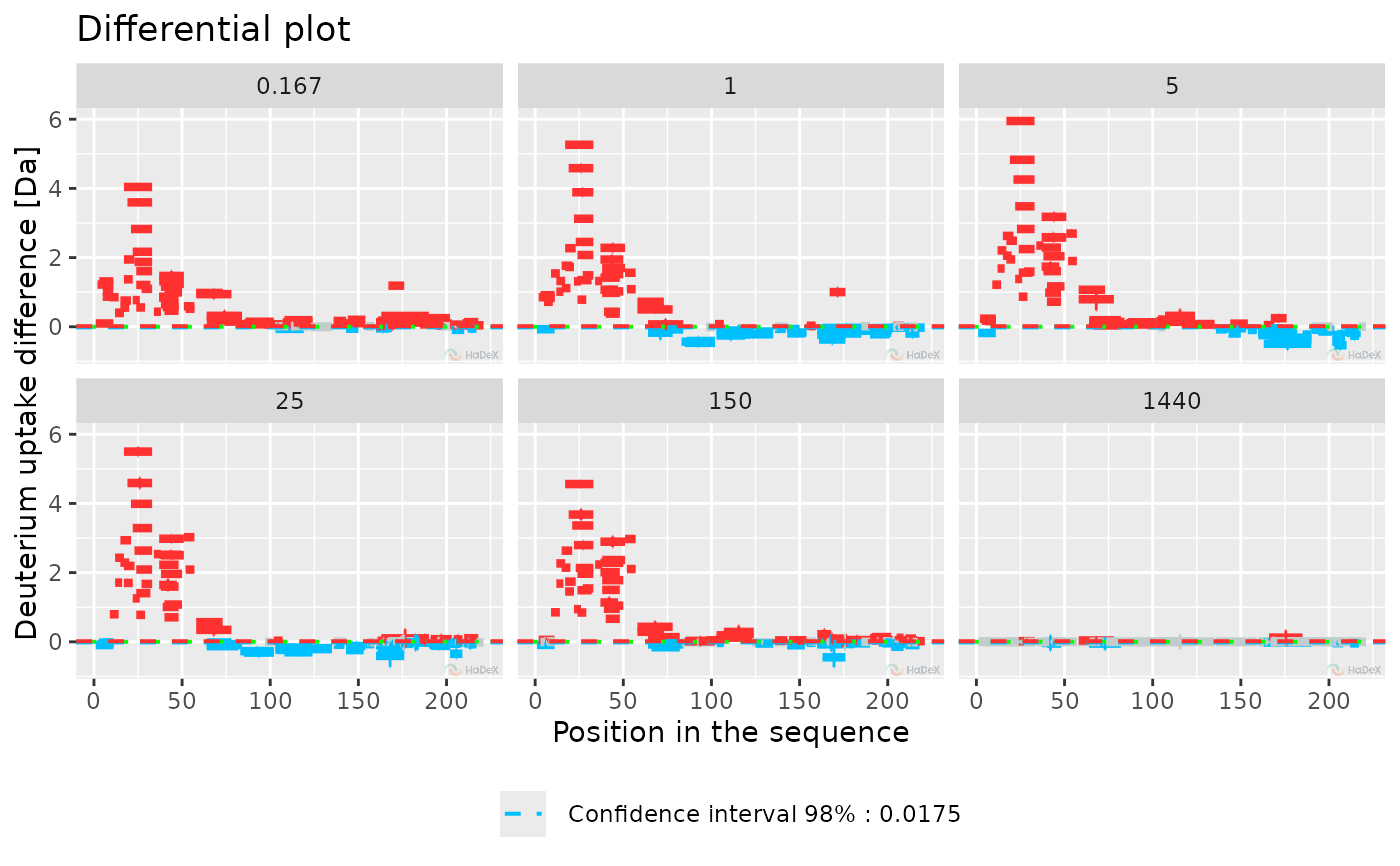
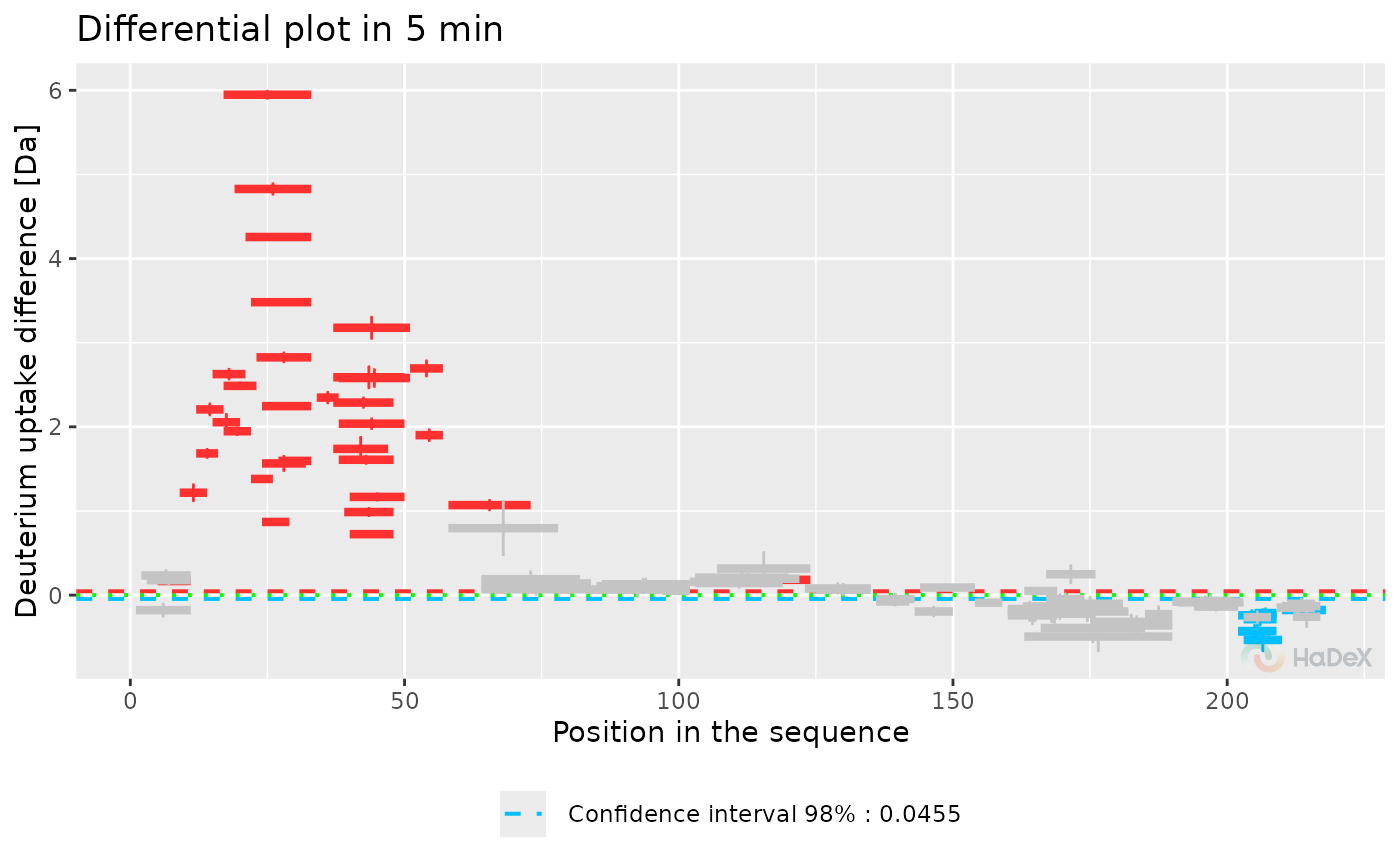
Function plot_differential presents
provided data in a form of differential (Woods) plot. The plot shows
difference in exchange for two biological states, selected in
generation of dataset at one time point of measurement. On X-axis
there is a position in a sequence, with length of a segment of each
peptide representing its length. On Y-axis there
is deuterium uptake difference in chosen form. Error bars represents
the combined and propagated uncertainty.
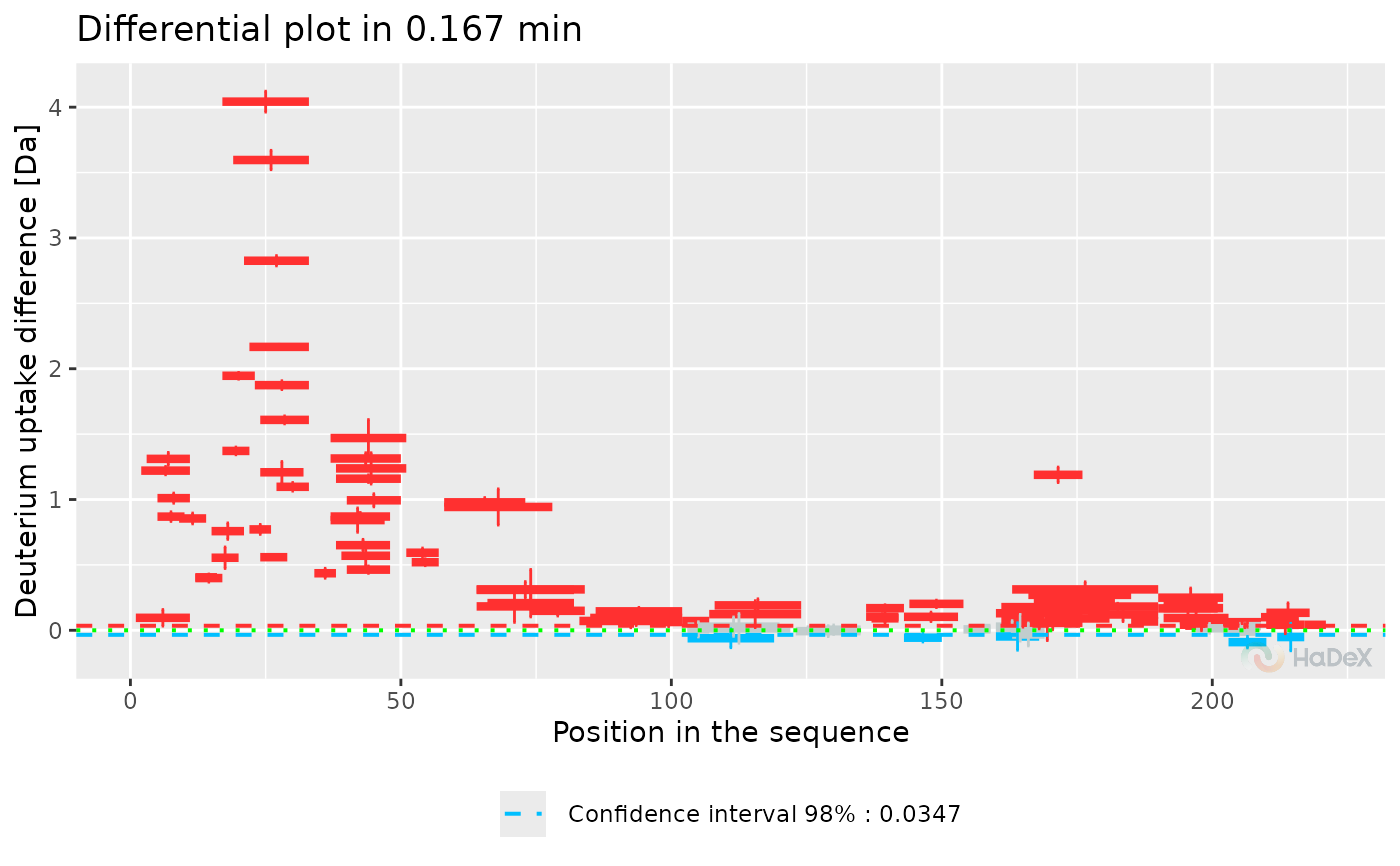
For Woods Plot there is available Houde test and t-Student test to
see the statistically significant peptides. Selecting both of them
simultaneously results in hybrid testing, as described in Weis et al.
The statistically significant values are in color (red if the
difference is positive, blue if negative), and the insignificant values are
grey.
References
Hageman, T. S. & Weis, D. D. Reliable Identification of Significant Differences in Differential Hydrogen Exchange-Mass Spectrometry Measurements Using a Hybrid Significance Testing Approach. Anal Chem 91, 8008–8016 (2019).
Examples
# \donttest{
# disabled due to long execution time
diff_uptake_dat <- calculate_diff_uptake(alpha_dat,
states = c("ALPHA_Gamma", "Alpha_KSCN"), time_t = 0.167)
plot_differential(diff_uptake_dat = diff_uptake_dat, time_t = 0.167)
 plot_differential(diff_uptake_dat = diff_uptake_dat, time_t = 0.167, show_houde_interval = TRUE)
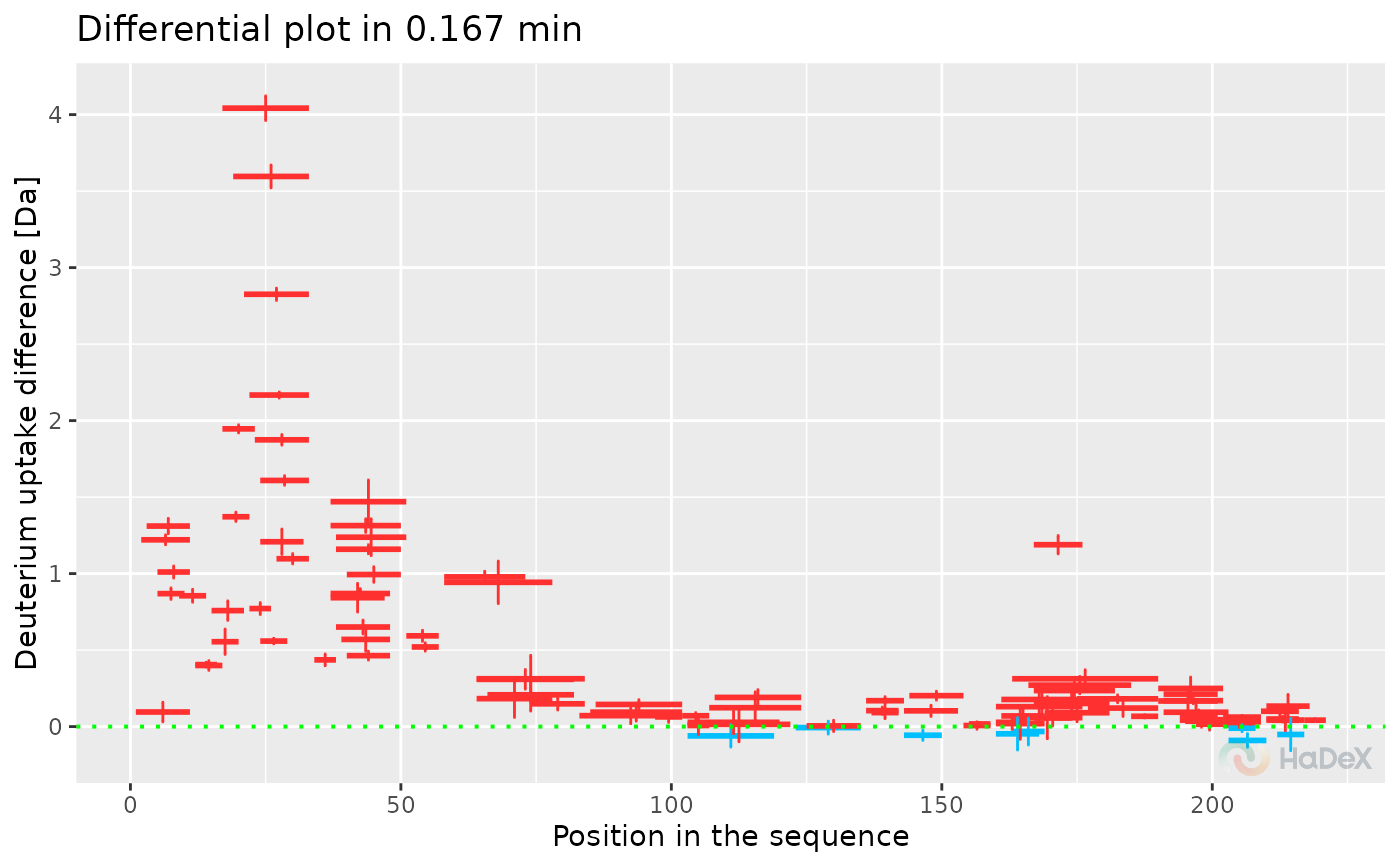
 plot_differential(diff_uptake_dat = diff_uptake_dat, time_t = 0.167, skip_amino = 0)
 plot_differential(diff_uptake_dat = diff_uptake_dat, time_t = 0.167, line_size = 1)
 plot_differential(diff_uptake_dat = diff_uptake_dat, all_times = TRUE)
 plot_differential(diff_uptake_dat = diff_uptake_dat, all_times = TRUE, show_houde_interval = TRUE)
 plot_differential(diff_uptake_dat = diff_uptake_dat, all_times = TRUE, show_houde_interval = TRUE,
hide_houde_insignificant = TRUE)
plot_differential(diff_uptake_dat = diff_uptake_dat, all_times = TRUE, show_houde_interval = TRUE,
hide_houde_insignificant = TRUE)
 diff_p_uptake_dat <- create_p_diff_uptake_dataset(alpha_dat, state_1 = "Alpha_KSCN",
state_2 = "ALPHA_Gamma")
plot_differential(diff_p_uptake_dat = diff_p_uptake_dat, all_times = TRUE,
show_tstud_confidence = TRUE)
diff_p_uptake_dat <- create_p_diff_uptake_dataset(alpha_dat, state_1 = "Alpha_KSCN",
state_2 = "ALPHA_Gamma")
plot_differential(diff_p_uptake_dat = diff_p_uptake_dat, all_times = TRUE,
show_tstud_confidence = TRUE)
 plot_differential(diff_p_uptake_dat = diff_p_uptake_dat, all_times = FALSE,
time_t = 0.167, show_tstud_confidence = TRUE, show_houde_interval = TRUE)
plot_differential(diff_p_uptake_dat = diff_p_uptake_dat, all_times = FALSE,
time_t = 0.167, show_tstud_confidence = TRUE, show_houde_interval = TRUE)
 plot_differential(diff_p_uptake_dat = diff_p_uptake_dat, show_tstud_confidence = TRUE,
show_houde_interval = TRUE, all_times = FALSE)
plot_differential(diff_p_uptake_dat = diff_p_uptake_dat, show_tstud_confidence = TRUE,
show_houde_interval = TRUE, all_times = FALSE)
 plot_differential(diff_p_uptake_dat = diff_p_uptake_dat, show_tstud_confidence = TRUE,
show_houde_interval = TRUE, all_times = FALSE, hide_houde_insignificant = TRUE)
plot_differential(diff_p_uptake_dat = diff_p_uptake_dat, show_tstud_confidence = TRUE,
show_houde_interval = TRUE, all_times = FALSE, hide_houde_insignificant = TRUE)
 plot_differential(diff_p_uptake_dat = diff_p_uptake_dat, show_tstud_confidence = TRUE,
show_houde_interval = TRUE, all_times = FALSE, hide_houde_insignificant = TRUE,
hide_tstud_insignificant = TRUE)
plot_differential(diff_p_uptake_dat = diff_p_uptake_dat, show_tstud_confidence = TRUE,
show_houde_interval = TRUE, all_times = FALSE, hide_houde_insignificant = TRUE,
hide_tstud_insignificant = TRUE)
 # }
# }