Chiclet deuterium uptake plot
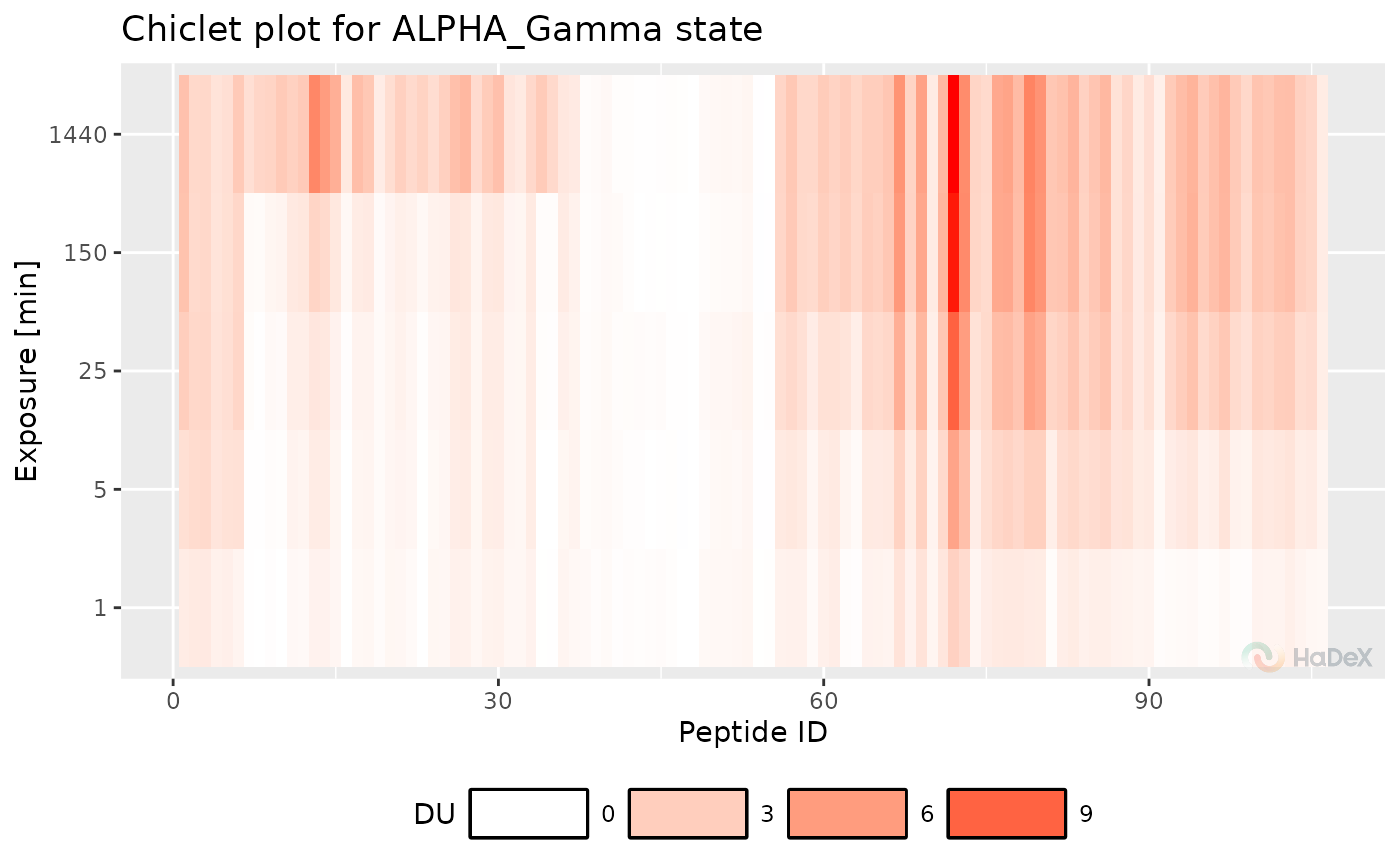
plot_chiclet.RdChiclet plot of deuterium uptake values in time for one biological state.
Usage
plot_chiclet(
  uptake_dat,
  theoretical = FALSE,
  fractional = FALSE,
  show_uncertainty = FALSE,
  interactive = getOption("hadex_use_interactive_plots")
)
Arguments
- uptake_dat
produced by
create_state_uptake_datasetfunction.- theoretical
logical, determines if values are theoretical.- fractional
logical, determines if values are fractional.- show_uncertainty
logical, determines if the uncertainty is shown.- interactive
logical, whether plot should have an interactive layer created with with ggiraph, which would add tooltips to the plot in an interactive display (HTML/Markdown documents or shiny app).
Value
a ggplot object.
Details
Function plot_chiclet produces a chiclet
plot based on the same dataset as butterfly plot, as it is the different
form of presenting the same data. On X-axis there is a peptide ID. On
Y-axis are time points of measurement. Each tile for a peptide in time has
a color value representing the deuterium uptake, in a form based on
provided criteria (e.q. fractional). Each tile has a plus sign, which size
represent the uncertainty of measurement for chosen value.
Examples
state_uptake_dat <- create_state_uptake_dataset(alpha_dat)
plot_chiclet(state_uptake_dat)
#> Warning: The `size` argument of `element_rect()` is deprecated as of ggplot2 3.4.0.
#> ℹ Please use the `linewidth` argument instead.
#> ℹ The deprecated feature was likely used in the HaDeX2 package.
#>   Please report the issue to the authors.