Plot replicates histogram
plot_replicate_histogram.RdPlot histogram on number of replicates per peptide in one or multiple time point of measurement.
Usage
plot_replicate_histogram(
  rep_dat,
  time_points = FALSE,
  interactive = getOption("hadex_use_interactive_plots")
)
Arguments
- rep_dat
replicate data, created by
create_replicate_datasetfunction.- time_points
logical, indicator if the histogram should show values aggregated for time points of measurements.- interactive
logical, whether plot should have an interactive layer created with with ggiraph, which would add tooltips to the plot in an interactive display (HTML/Markdown documents or shiny app).
Details
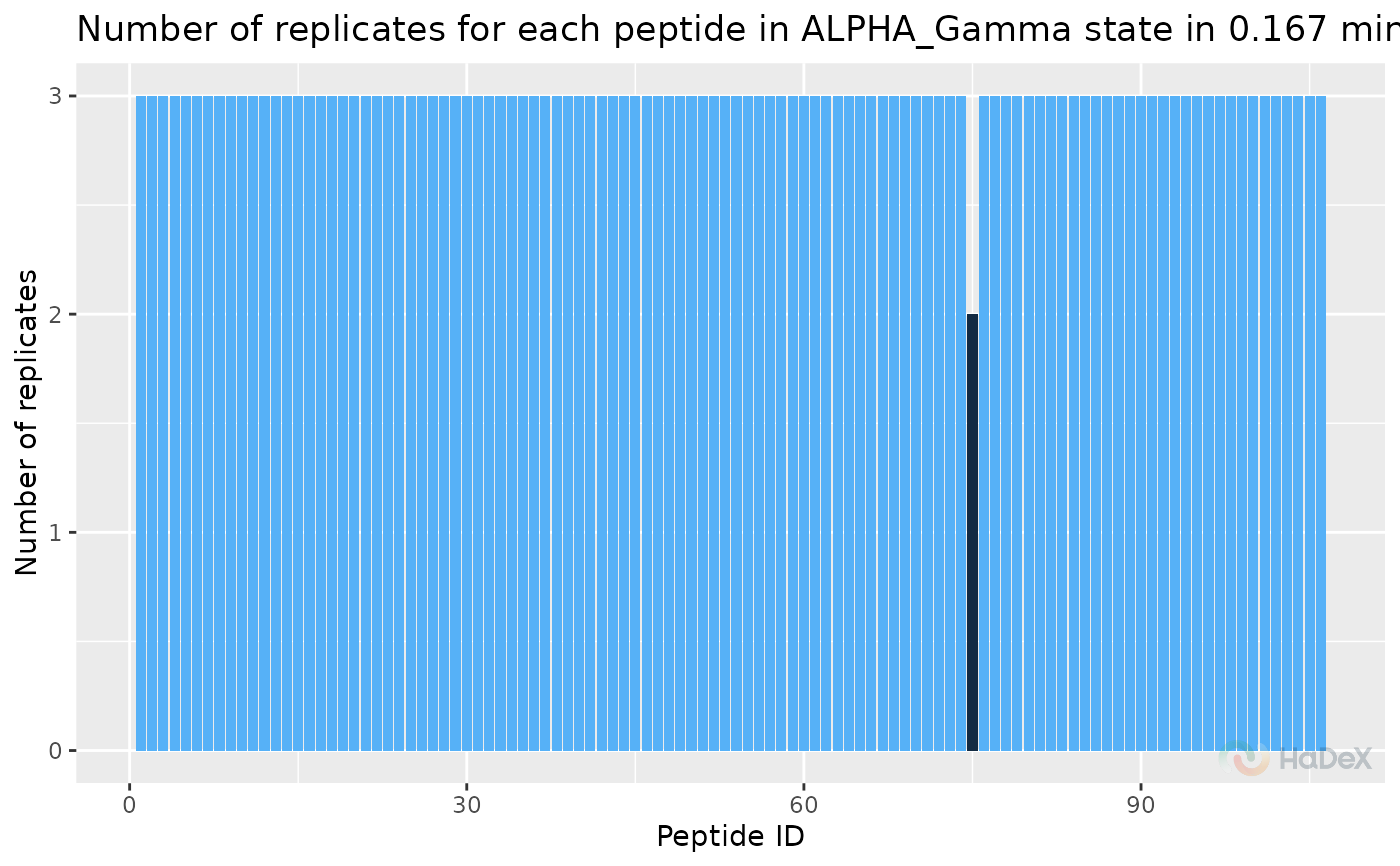
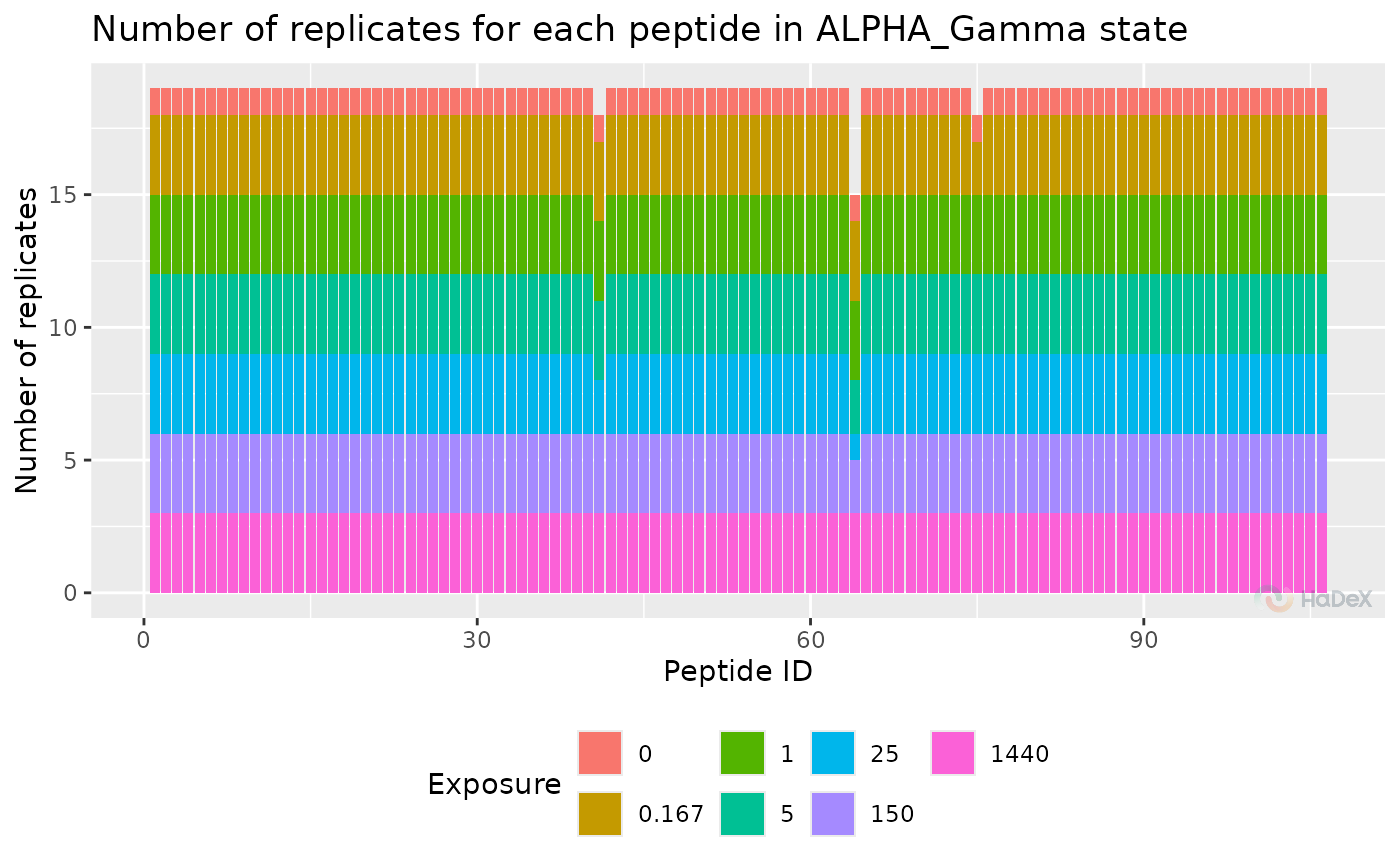
The function shows three versions of replicate
histogram, based on supplied rep_dat and time_points.
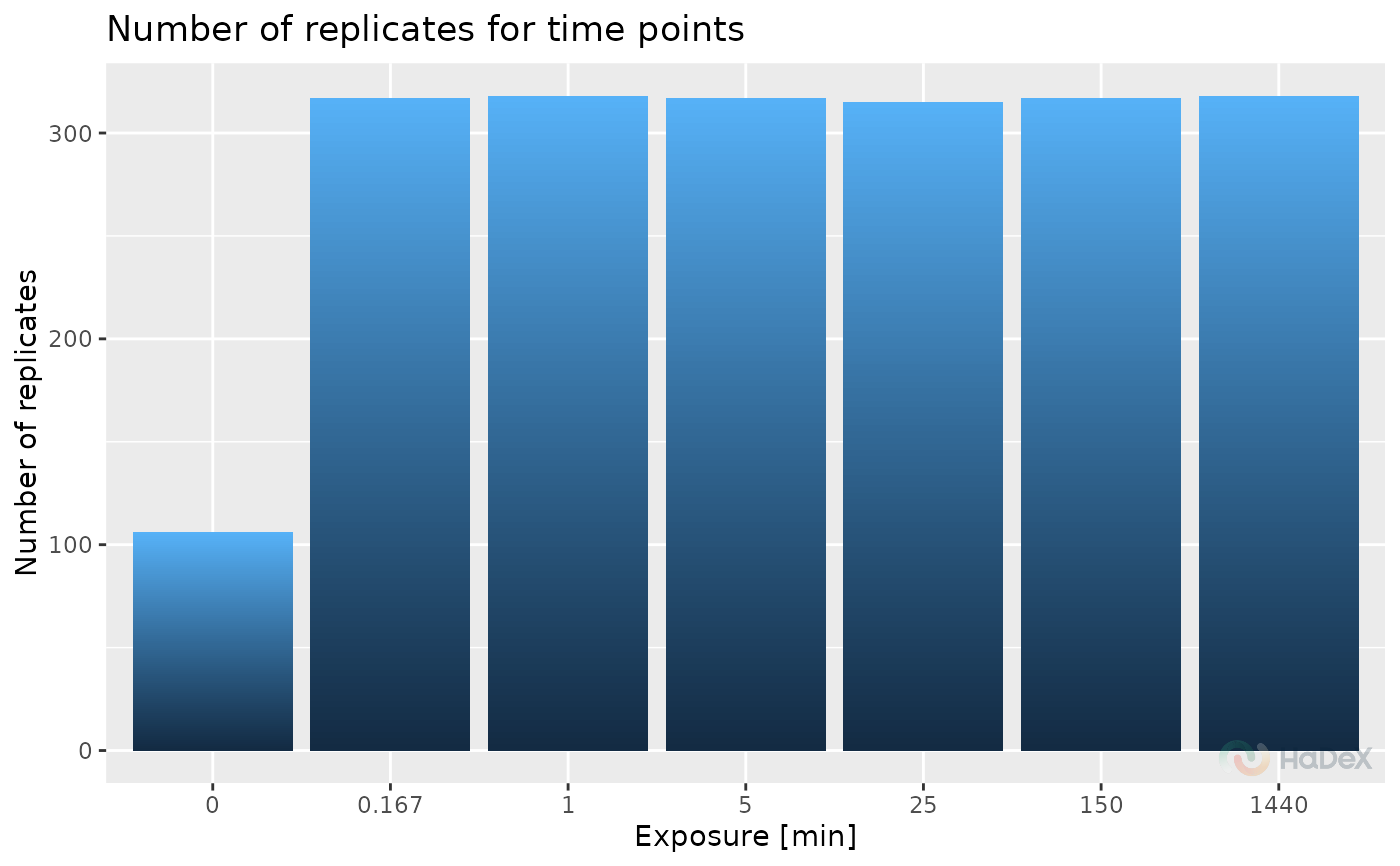
If time_points is selected, the histogram shows the number
of replicates for time points of measurement, to spot
if there were troubles with samples for specific time point of
measurement. Then, on the X-axis is Exposure (in minutes) and
on the Y-axis number of replicates.
If time_points is not selected, on the X-axis there are
peptide ID, and on the Y-axis there are numbers of replicates.
If rep_dat contains data from one time point
of measurement, the histogram colors reflect the
number of replicates to highlight the outliers.
If rep_dat contains multiple time point of
measurement, the colors help to distinguish between
them.
Examples
rep_dat <- create_replicate_dataset(alpha_dat)
plot_replicate_histogram(rep_dat)


plot_replicate_histogram(rep_dat, time_points = TRUE)


rep_dat <- create_replicate_dataset(alpha_dat, time_t = 0.167)
plot_replicate_histogram(rep_dat)
rep_dat <- create_replicate_dataset(alpha_dat, time_t = 0.167)
plot_replicate_histogram(rep_dat)