Position frequency
plot_position_frequency.RdPlot the frequency of coverage for protein sequence
Arguments
- dat
data as imported by the
read_hdxfunction- protein
selected protein
- state
selected biological state for given protein
Value
a ggplot object.
Details
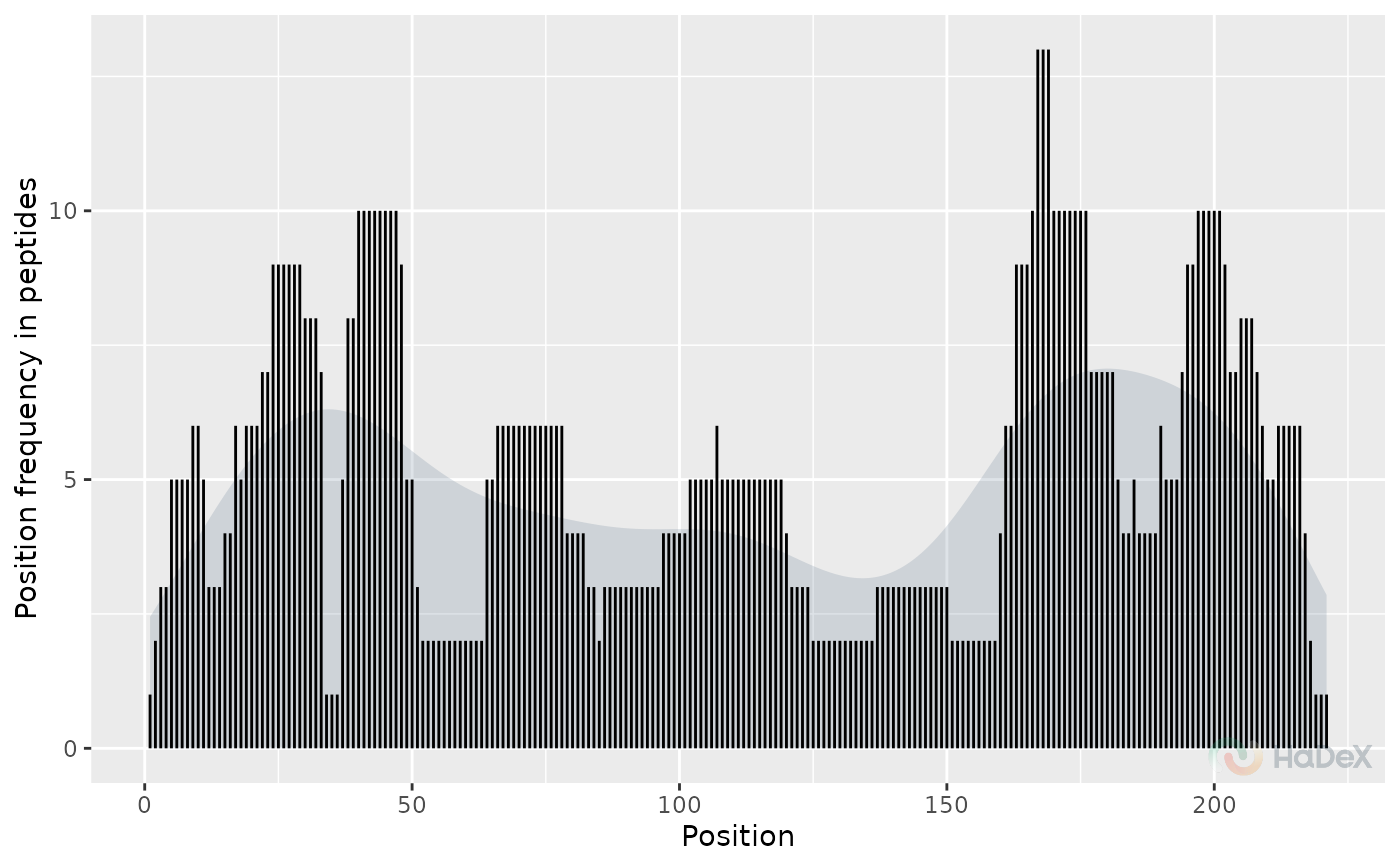
The function plot_position_frequency generates a
histogram of the coverage frequency in selected biological states
for selected protein.
The position frequency plot presents how many times each position of
the sequence is covered by different peptides.