Peptide coverage
plot_coverage.RdPlot the peptide coverage of the protein sequence
Usage
plot_coverage(
  dat,
  protein = dat[["Protein"]][1],
  states = NULL,
  show_blanks = TRUE,
  interactive = getOption("hadex_use_interactive_plots")
)
Arguments
- dat
data imported by the
read_hdxfunction- protein
selected protein
- states
selected biological states for given protein
- show_blanks
logical, indicator if the non-covered regions of the sequence are indicated in red- interactive
logical, whether plot should have an interactive layer created with with ggiraph, which would add tooltips to the plot in an interactive display (HTML/Markdown documents or shiny app)
Value
a ggplot object
Details
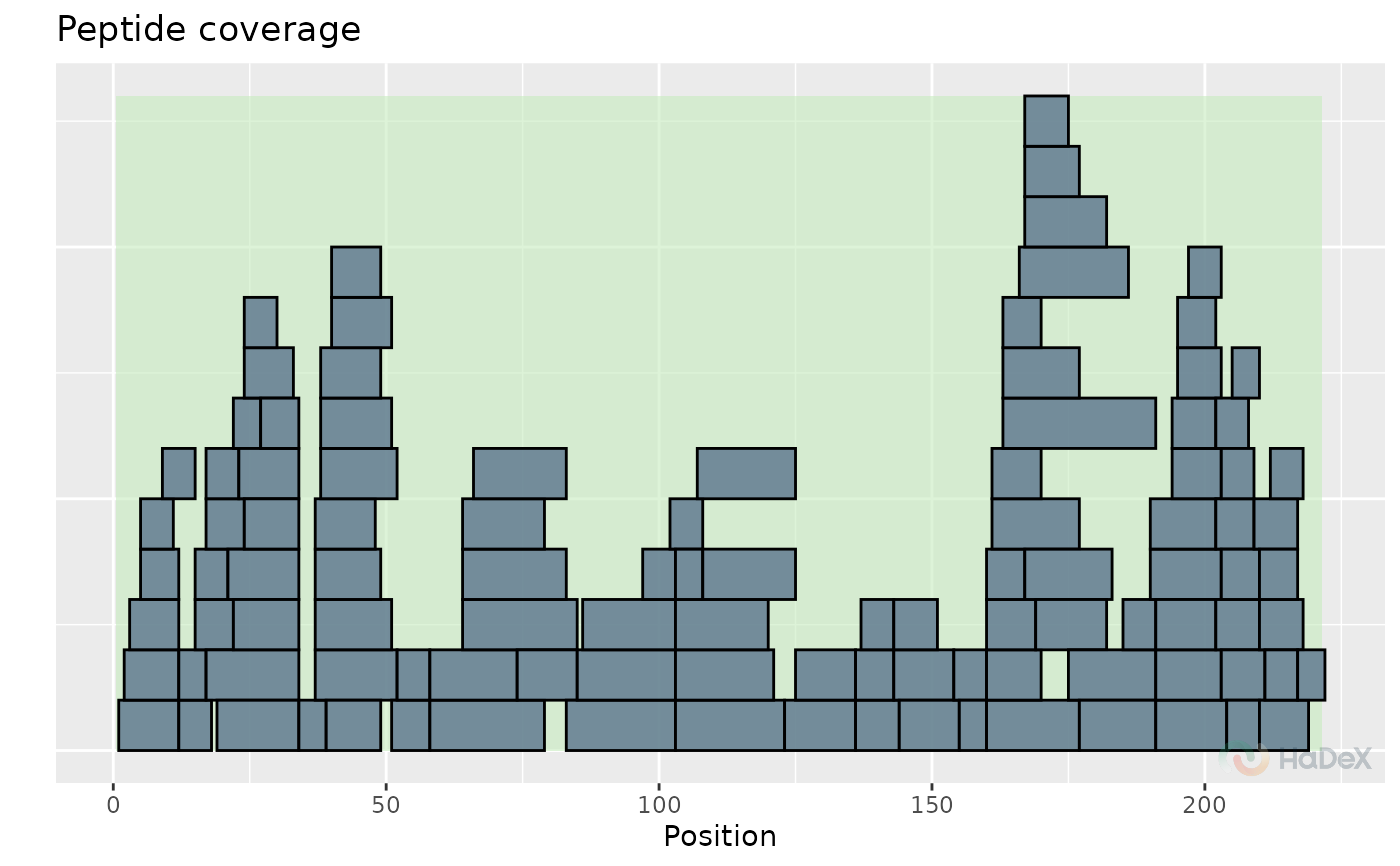
The function plot_coverage generates
sequence coverage plot based on experimental data for
selected protein in selected biological states. Only non-duplicated
peptides are shown on the plot, next to each other.
The aim of this plot is to see the dependence between position of the peptide on the protein sequence. Their position on y-axis does not contain any information.
Examples
plot_coverage(alpha_dat)
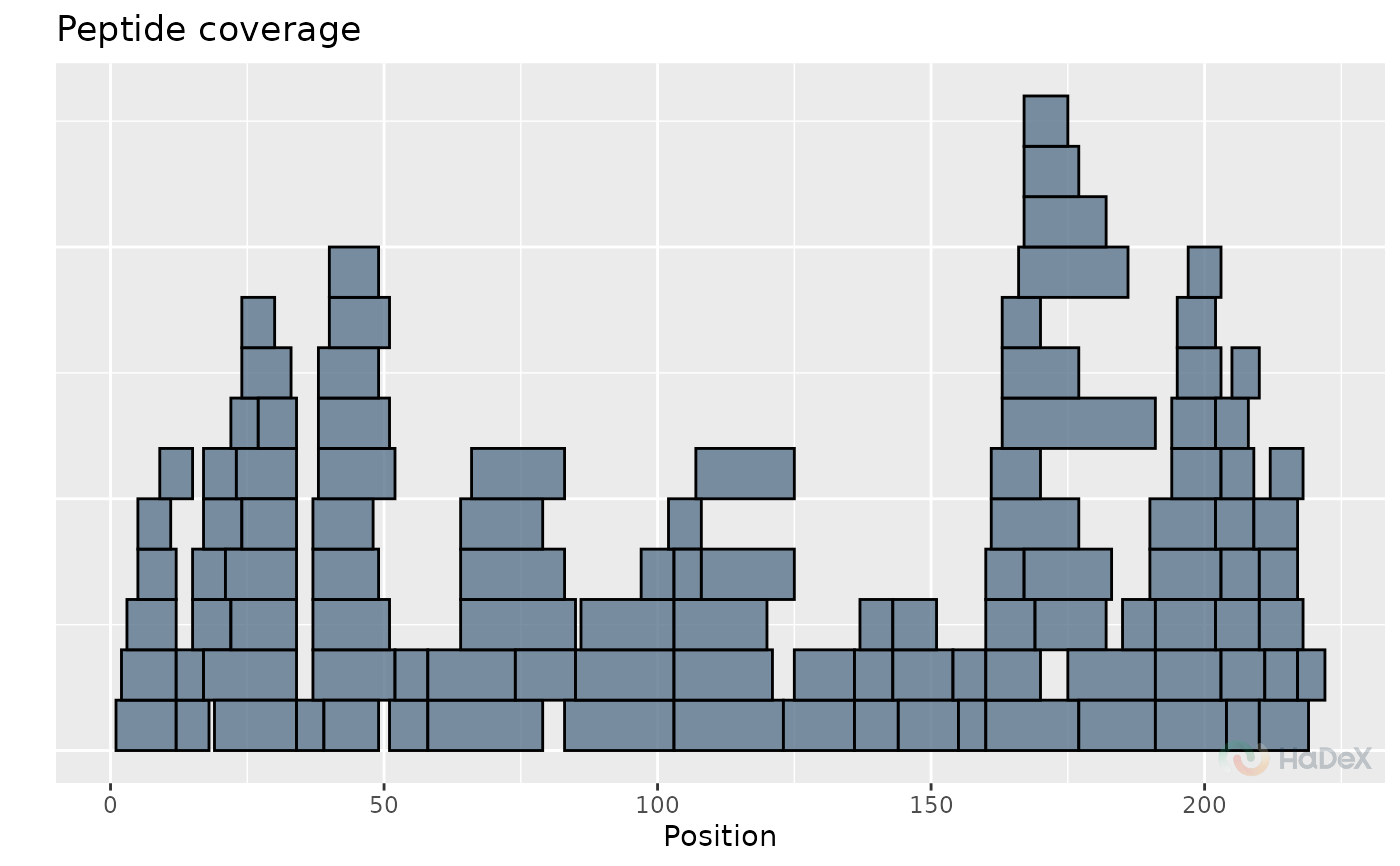
 plot_coverage(alpha_dat, show_blanks = FALSE)
 diff_uptake_dat <- create_diff_uptake_dataset(alpha_dat)
plot_coverage(diff_uptake_dat)
diff_uptake_dat <- create_diff_uptake_dataset(alpha_dat)
plot_coverage(diff_uptake_dat)