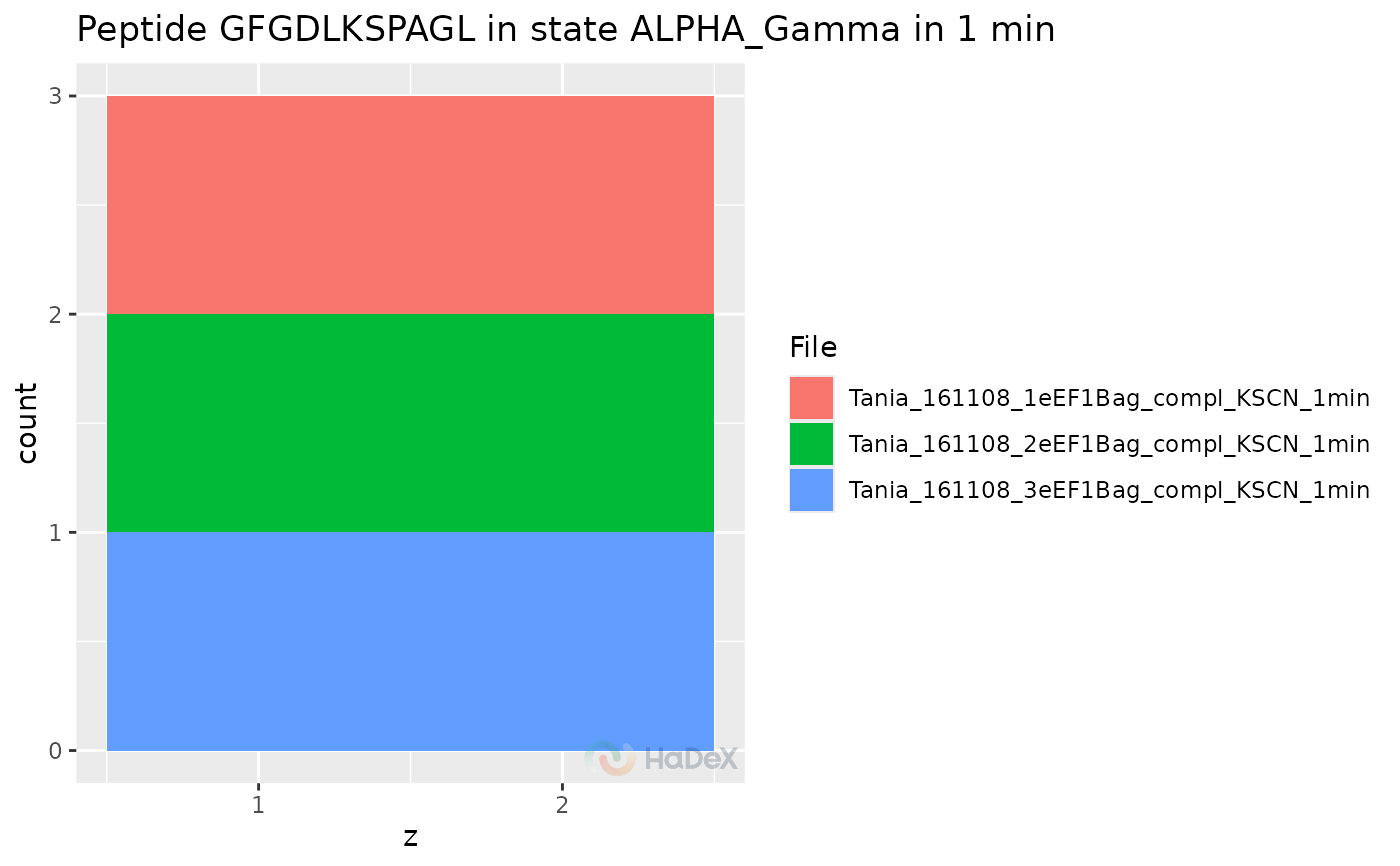
Plot peptide charge measurement
plot_peptide_charge_measurement.RdPlot the charge measurements from replicates for peptide in specific time point.
Usage
plot_peptide_charge_measurement(
  dat,
  protein = dat[["Protein"]][1],
  state = dat[["State"]][1],
  sequence = dat[["Sequence"]][1],
  time_t = unique(dat[["Exposure"]])[3]
)
Arguments
- dat
data as imported by the
read_hdxfunction.- protein
chosen protein.
- state
biological state for chosen protein.
- sequence
sequence of chosen peptide.
- time_t
time point of the measurement.
Details
This function shows the measurements of charge from different replicates for specific peptide in specific state in specific time point of measurement on the plot.