Deuterium uptake curve
plot_uptake_curve.RdPlot deuterium uptake curve for selected peptides
Usage
plot_uptake_curve(
  uc_dat,
  theoretical = FALSE,
  fractional = FALSE,
  uncertainty_type = "ribbon",
  log_x = TRUE,
  interactive = getOption("hadex_use_interactive_plots")
)
Arguments
- uc_dat
data produced by
calculate_kineticsorcalculate_peptide_kineticsorcreate_kinetic_datasetfunctions- theoretical
logical, indicator if values are calculated using theoretical controls- fractional
logical, indicator if values are shown in fractional form- uncertainty_type
type of uncertainty presentation, possible values: "ribbon", "bars" or "bars + line"
- log_x
logical, indicator if the X axis values are transformed to log10- interactive
logical, whether plot should have an interactive layer created with with ggiraph, which would add tooltips to the plot in an interactive display (HTML/Markdown documents or shiny app).
Value
a ggplot object.
Details
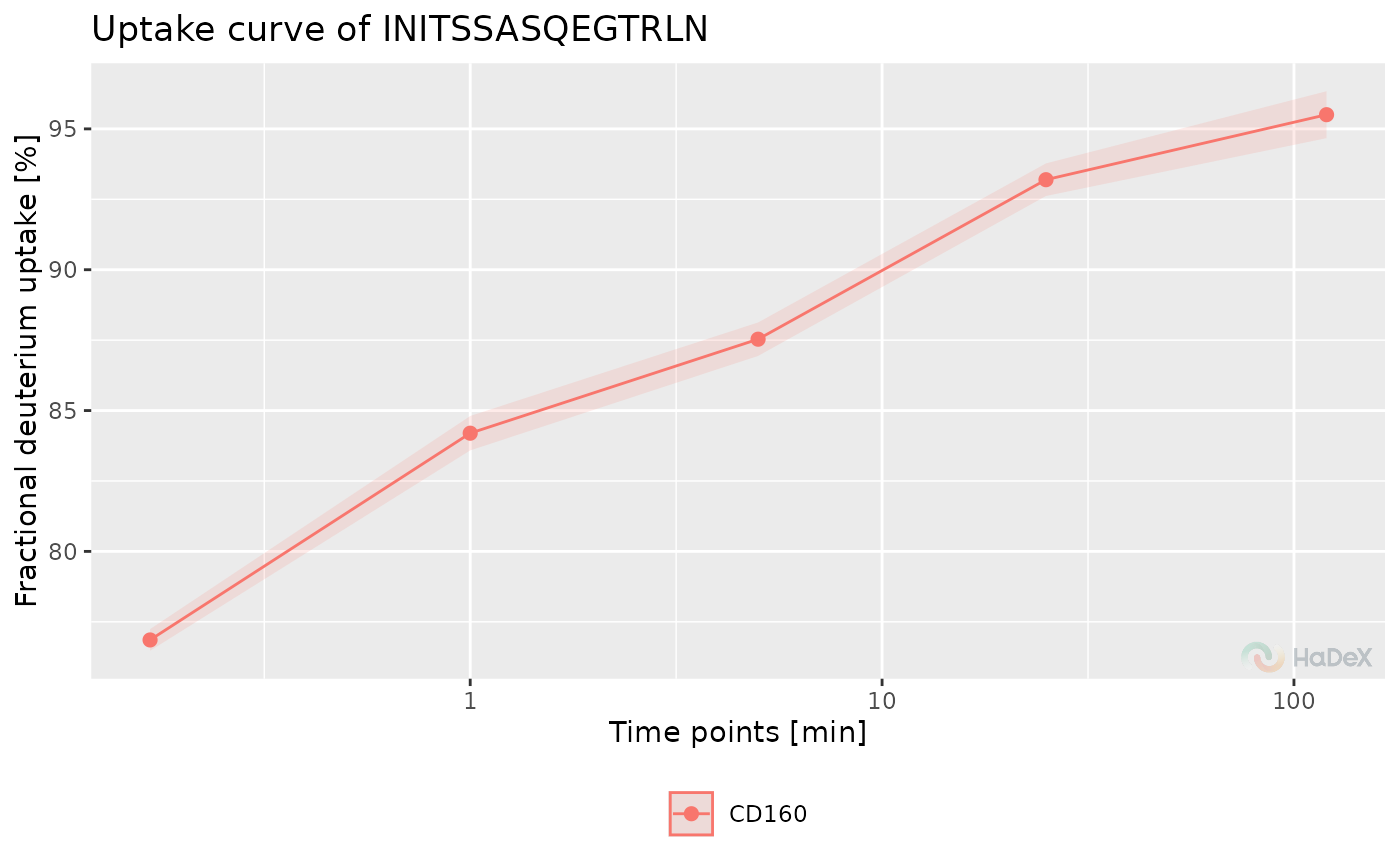
The function plot_uptake_curve generates
the deuterium uptake curve for selected peptides
from selected protein.
On X-axis there are time points of measurements. On Y-axis there
is deuterium uptake in selected form. The combined and propagated
uncertainty can be presented as ribbons or error bars.
Examples
uc_dat <- calculate_kinetics(alpha_dat, protein = "db_eEF1Ba",
                             sequence = "GFGDLKSPAGL",
                             state = "Alpha_KSCN",
                             start = 1, end = 11,
                             time_0 = 0, time_100 = 1440)
plot_uptake_curve(uc_dat = uc_dat,
                  theoretical = FALSE,
                  fractional = TRUE)
#> Warning: NaNs produced