State deuterium uptake comparison
plot_state_comparison.RdComparison plot of deuterium uptake values in time point for biological states.
Usage
plot_state_comparison(
  uptake_dat,
  skip_amino = 0,
  theoretical = FALSE,
  fractional = FALSE,
  line_size = 1.5,
  all_times = FALSE,
  time_t = NULL,
  interactive = getOption("hadex_use_interactive_plots")
)
Arguments
- uptake_dat
data produced by
calculate_state_uptakefunction- skip_amino
integer, indicator how many amino acids from the N-terminus should be omitted- theoretical
logical, indicator if values are calculated using theoretical controls- fractional
logical, indicator if values are shown in fractional form- line_size
line size for the plot
- all_times
logical, indicator is all all time should be plotted next to each other- time_t
chosen time point
- interactive
logical, whether plot should have an interactive layer created with with ggiraph, which would add tooltips to the plot in an interactive display (HTML/Markdown documents or shiny app)
Details
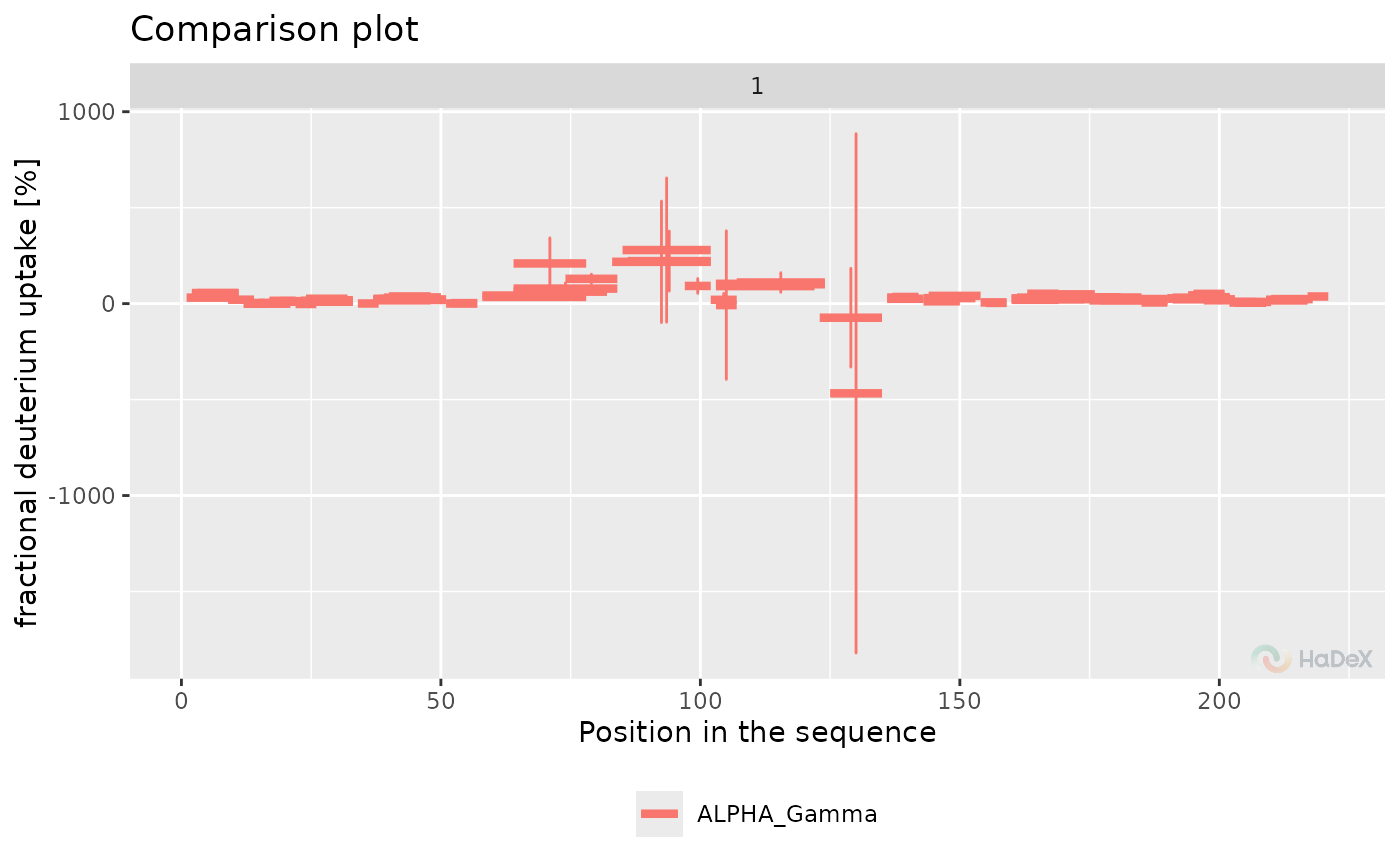
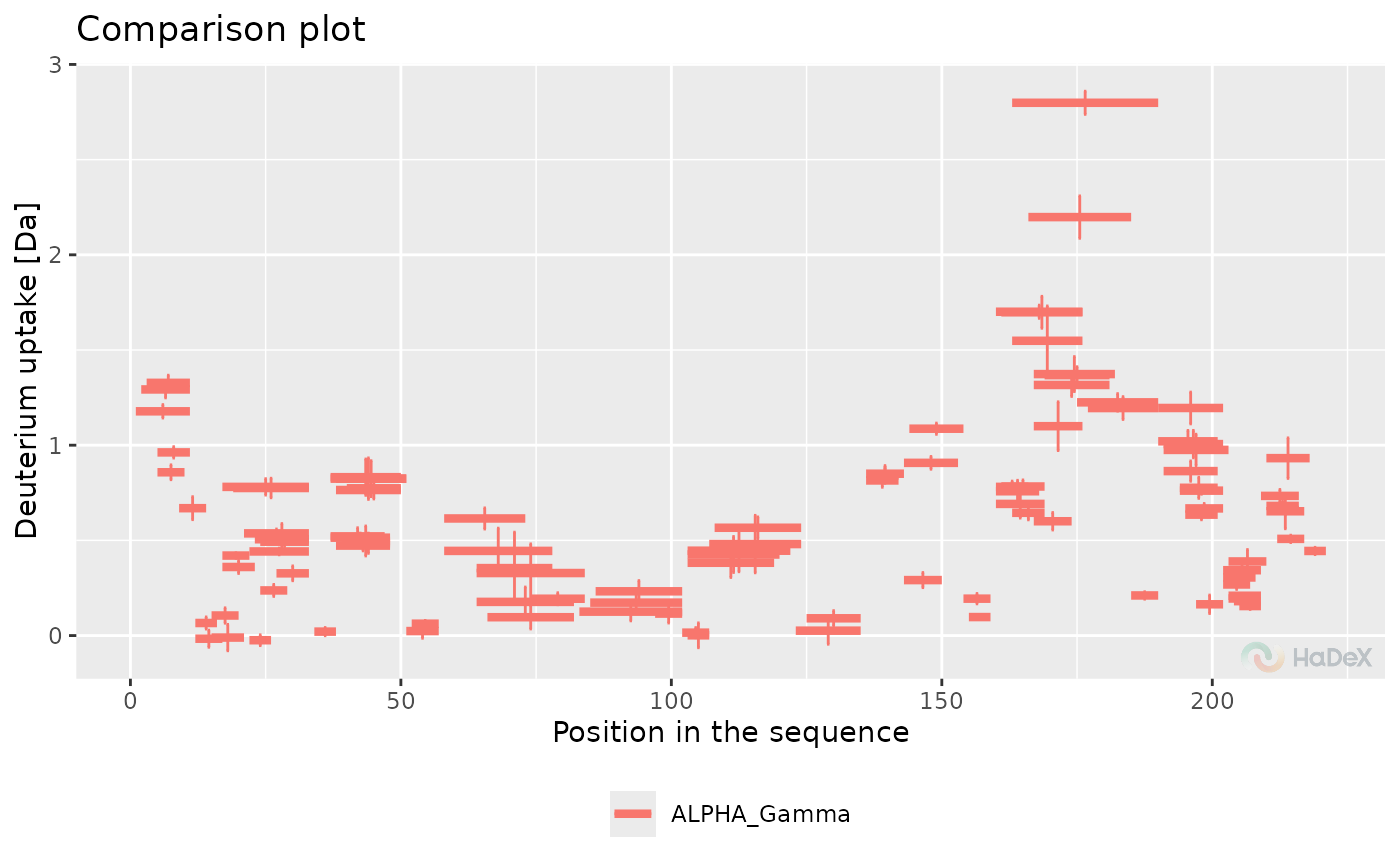
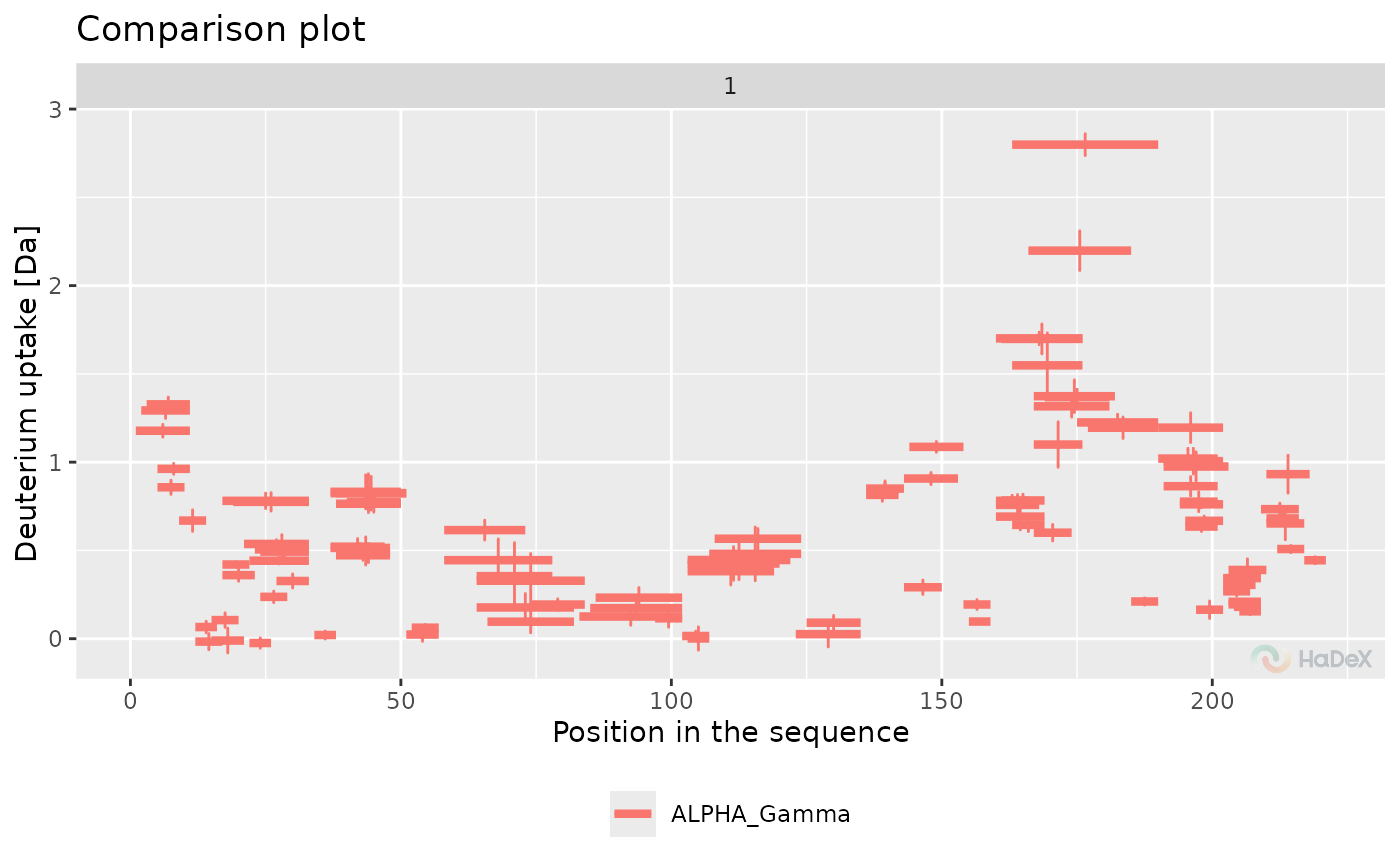
The function plot_state_comparison generates
a comparison plot, presenting deuterium uptake values of peptides
from selected protein in selected biological states at one time point
of measurement at once.
On X-axis there is a position in a sequence, with length of a segment
of each peptide representing its length. On Y-axis there
is deuterium uptake in selected form. Error bars represents the combined
and propagated uncertainty.
Examples
uptake_dat <- calculate_state_uptake(alpha_dat)
plot_state_comparison(uptake_dat)


plot_state_comparison(uptake_dat, all_times = TRUE)

plot_state_comparison(uptake_dat, fractional = TRUE, all_times = TRUE)