Replicate mass uptake curve
plot_replicate_mass_uptake.RdPlot the mass uptake curve for selected peptide to see the difference between replicates.
Usage
plot_replicate_mass_uptake(
  dat,
  protein = dat[["Protein"]][1],
  state = dat[["State"]][1],
  sequence = dat[["Sequence"]][1],
  aggregated = FALSE,
  log_x = TRUE,
  interactive = getOption("hadex_use_interactive_plots")
)
Arguments
- dat
data imported by the
read_hdxfunction- protein
selected protein
- state
selected biological state for given protein
- sequence
selected peptide sequence for given protein in given biological state
- aggregated
logical, indicator if presented data is aggregated on replicate level- log_x
logical, indicator if the X axis values are transformed to log10- interactive
logical, whether plot should have an interactive layer created with with ggiraph, which would add tooltips to the plot in an interactive display (HTML/Markdown documents or shiny app)
Value
a ggplot object.
Details
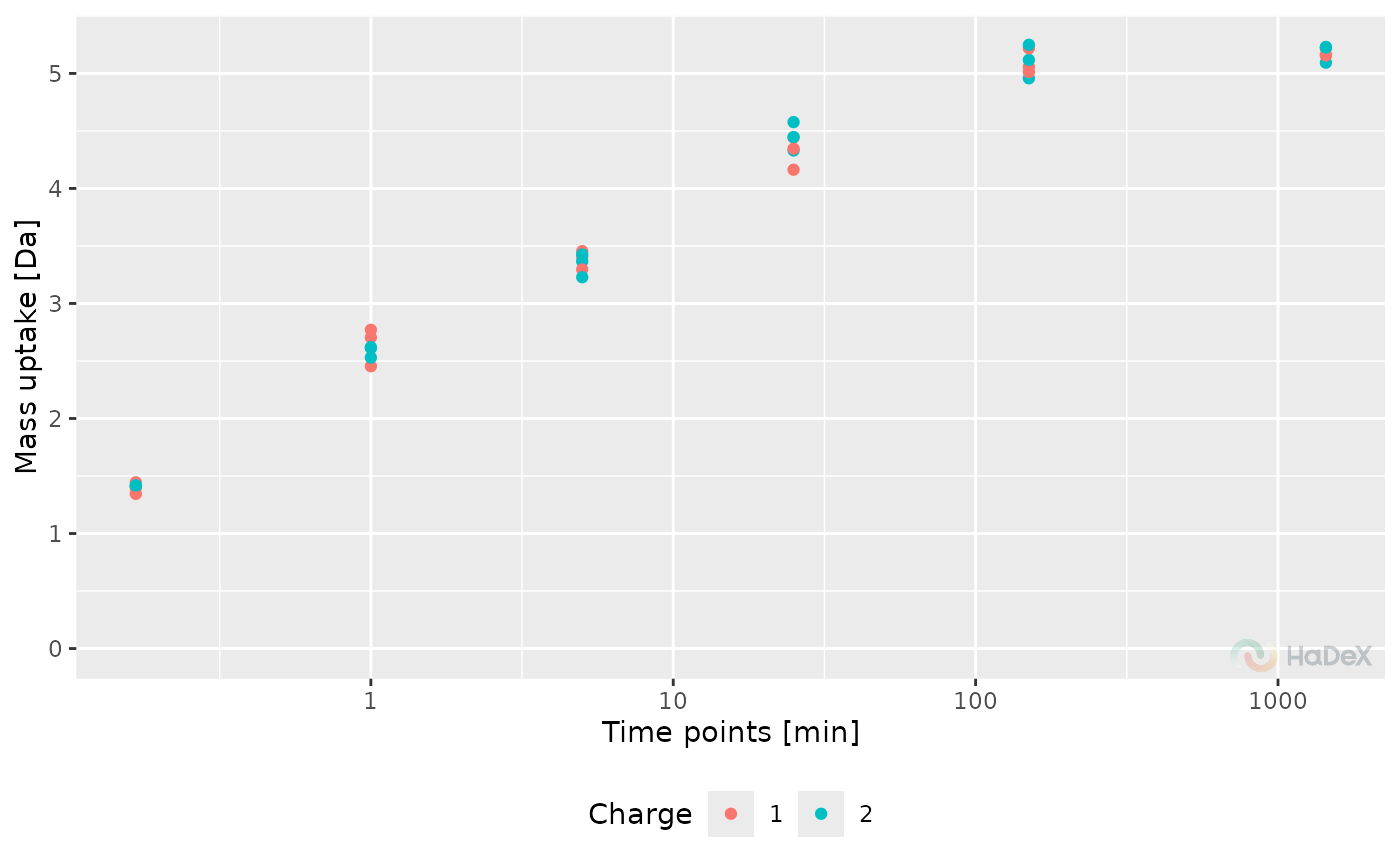
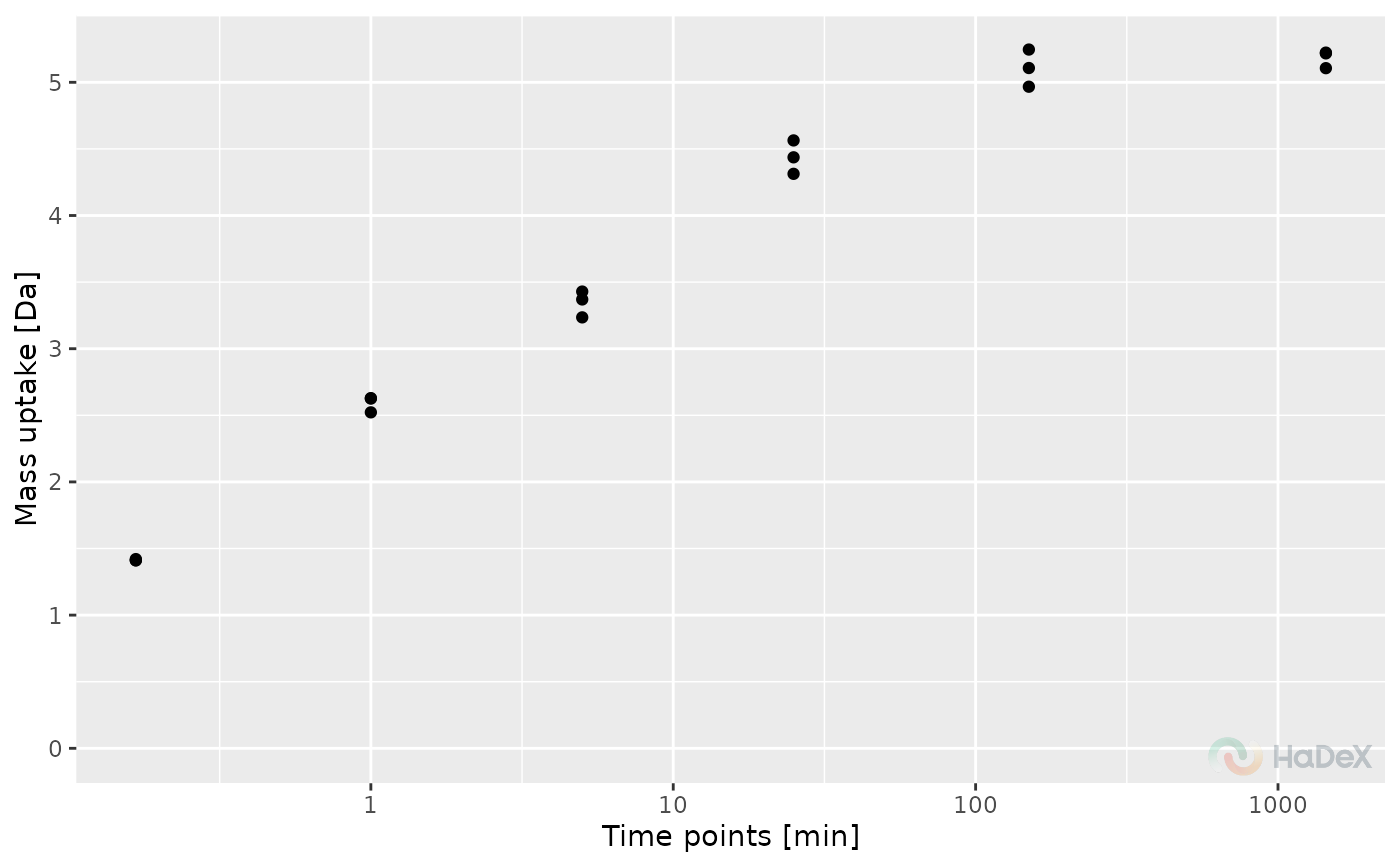
The function plot_replicate_mass_uptake
generates a plot showing the mass uptake for selected protein
in replicates of the experiments. The values can be presented
in two ways: as aggregated values for each replicate, or before
aggregation - measured values for charge values within a replicate.
The mass uptake is generated by subtracting the MHP mass of a peptide
from measured mass and the mass uptake is presented in Daltons.