Plot peptide mass measurement
plot_peptide_mass_measurement.RdPlot the mass measurements from replicates for peptide in specific time point.
Arguments
- dat
data produced by
read_hdxfunction- protein
chosen protein
- state
biological state for chosen protein
- sequence
sequence of chosen peptide
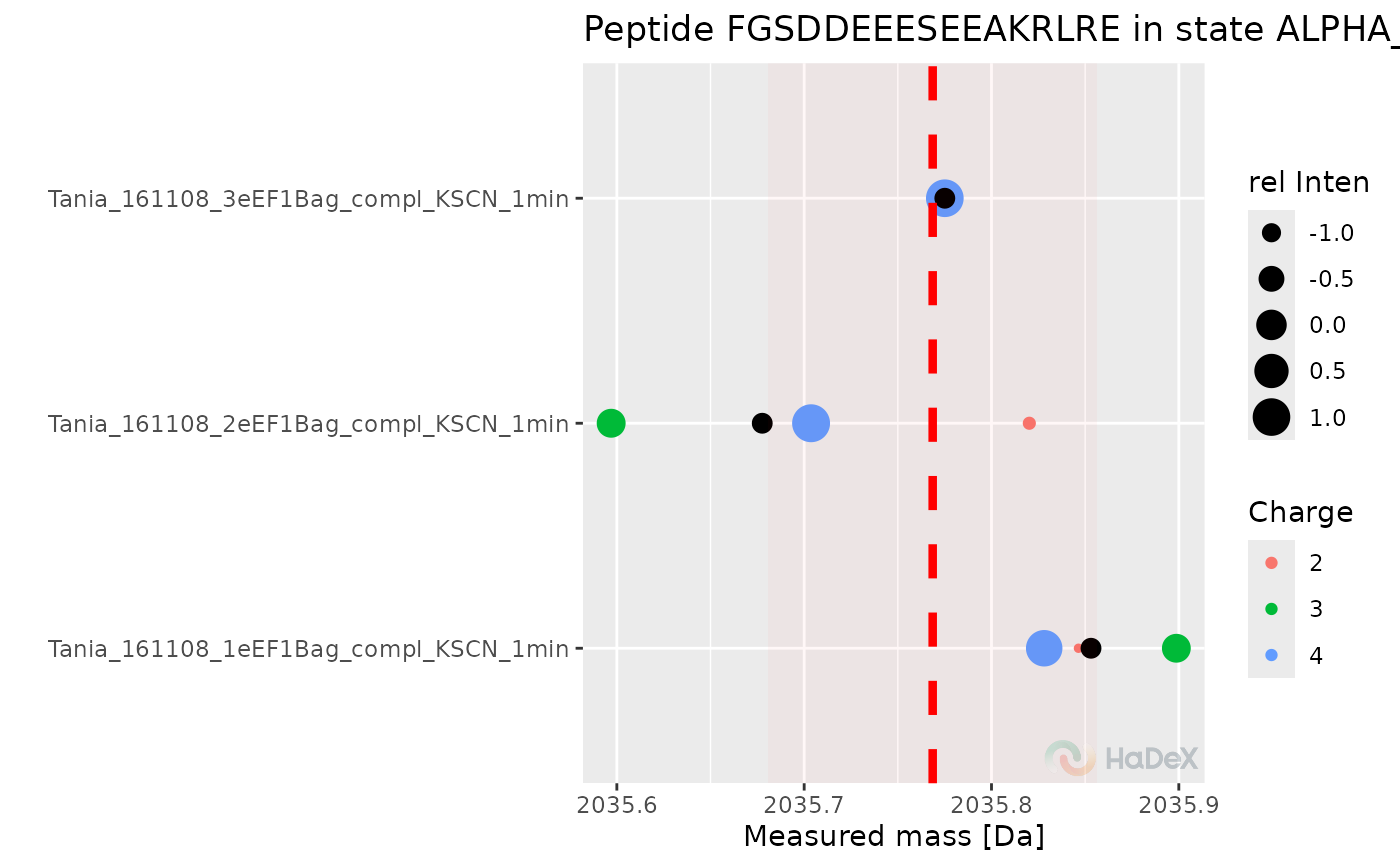
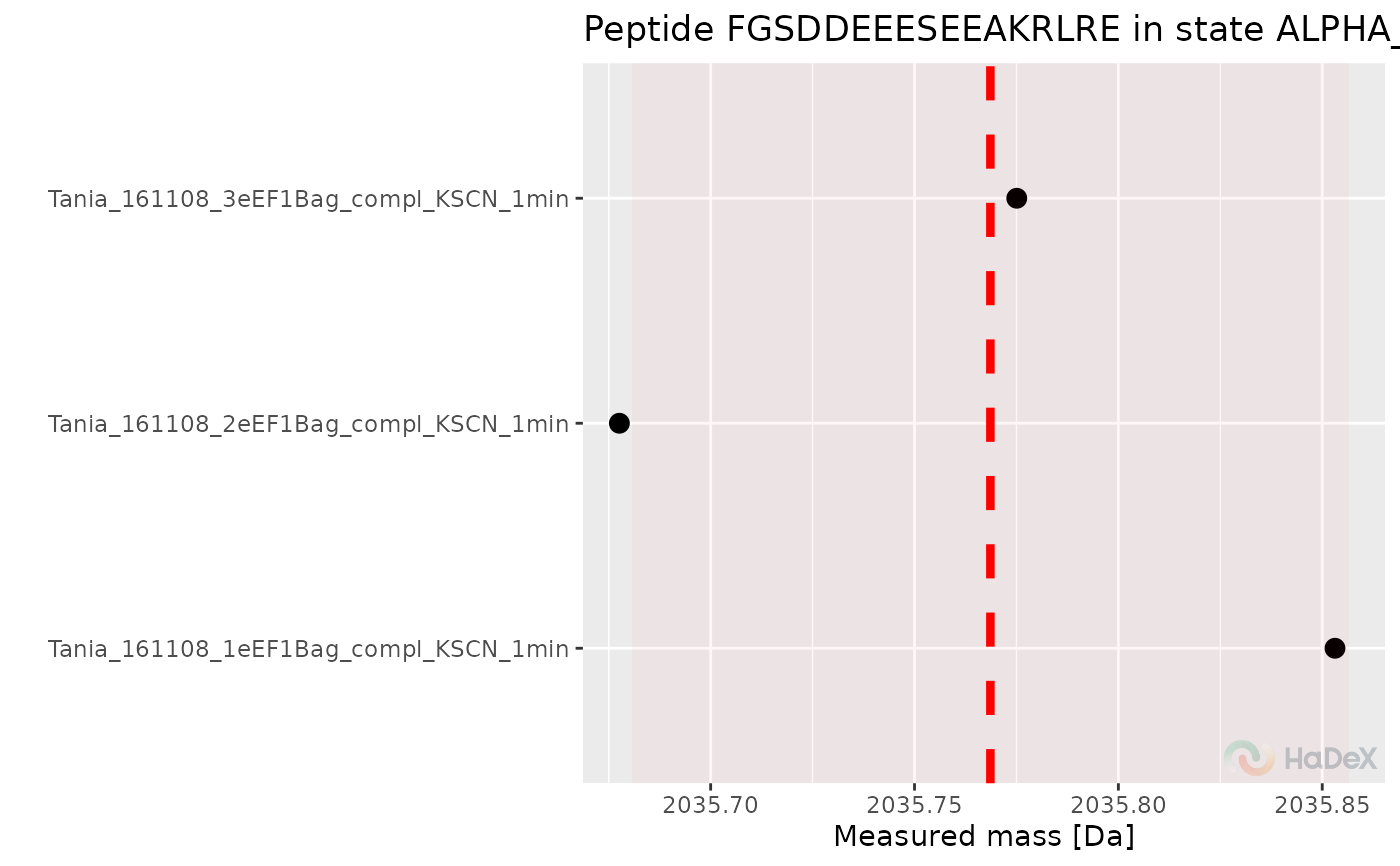
- show_charge_values
logical, indicator if the data is shown for replicates or for charge values within the replicates- time_t
chosen time point
- interactive
logical, whether plot should have an interactive layer created with with ggiraph, which would add tooltips to the plot in an interactive display (HTML/Markdown documents or shiny app)
Details
This function shows the measurements of mass from different replicates for specific peptide in specific state in specific time point of measurement on the plot. Moreover, on the plot is shown the average mass from the replicates, used later in calculations. The ribbon next to the dotted average mass indicates the uncertainty.