Plot overlap data
plot_overlap.RdGenerates overlapping peptide plot based on supplied data and parameters.
Arguments
- dat
data imported by the
read_hdxfunction.- protein
protein included in calculations
- state
state included in calculations
Value
a ggplot object.
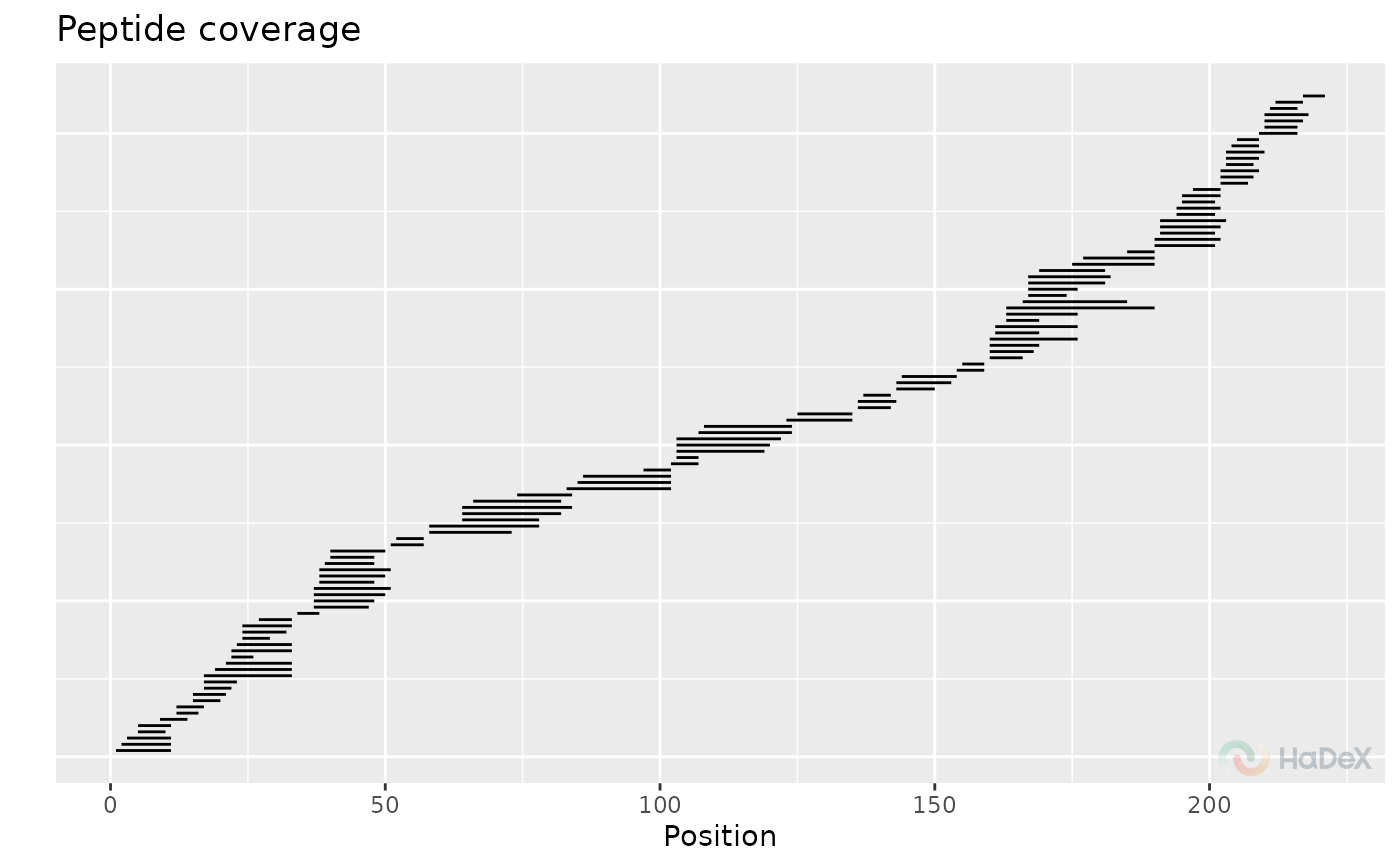
Details
The overlap plot presents all the peptides in given state on the protein sequence. This plot is visible in GUI.