Chiclet differential deuterium uptake plot
plot_differential_chiclet.RdChiclet plot of differential deuterium uptake values between two biological states in time.
Usage
plot_differential_chiclet(
  diff_uptake_dat = NULL,
  diff_p_uptake_dat = NULL,
  theoretical = FALSE,
  fractional = FALSE,
  show_houde_interval = FALSE,
  show_tstud_confidence = FALSE,
  confidence_level = 0.98,
  show_uncertainty = FALSE,
  interactive = getOption("hadex_use_interactive_plots")
)
Arguments
- diff_uptake_dat
data produced by
calculate_diff_uptakeorcreate_diff_uptake_datasetfunction- diff_p_uptake_dat
differential uptake data alongside the P-value as calculated by
create_p_diff_uptake_dataset- theoretical
logical, determines if values are theoretical- fractional
logical, determines if values are fractional- show_houde_interval
logical, determines if houde interval is shown- show_tstud_confidence
logical, determines if t-Student test validity is shown- confidence_level
confidence level for the test, from range [0, 1] Important if selected show_confidence_limit
- show_uncertainty
logical, determines if the uncertainty is shown- interactive
logical, whether plot should have an interactive layer created with with ggiraph, which would add tooltips to the plot in an interactive display (HTML/Markdown documents or shiny app).
Details
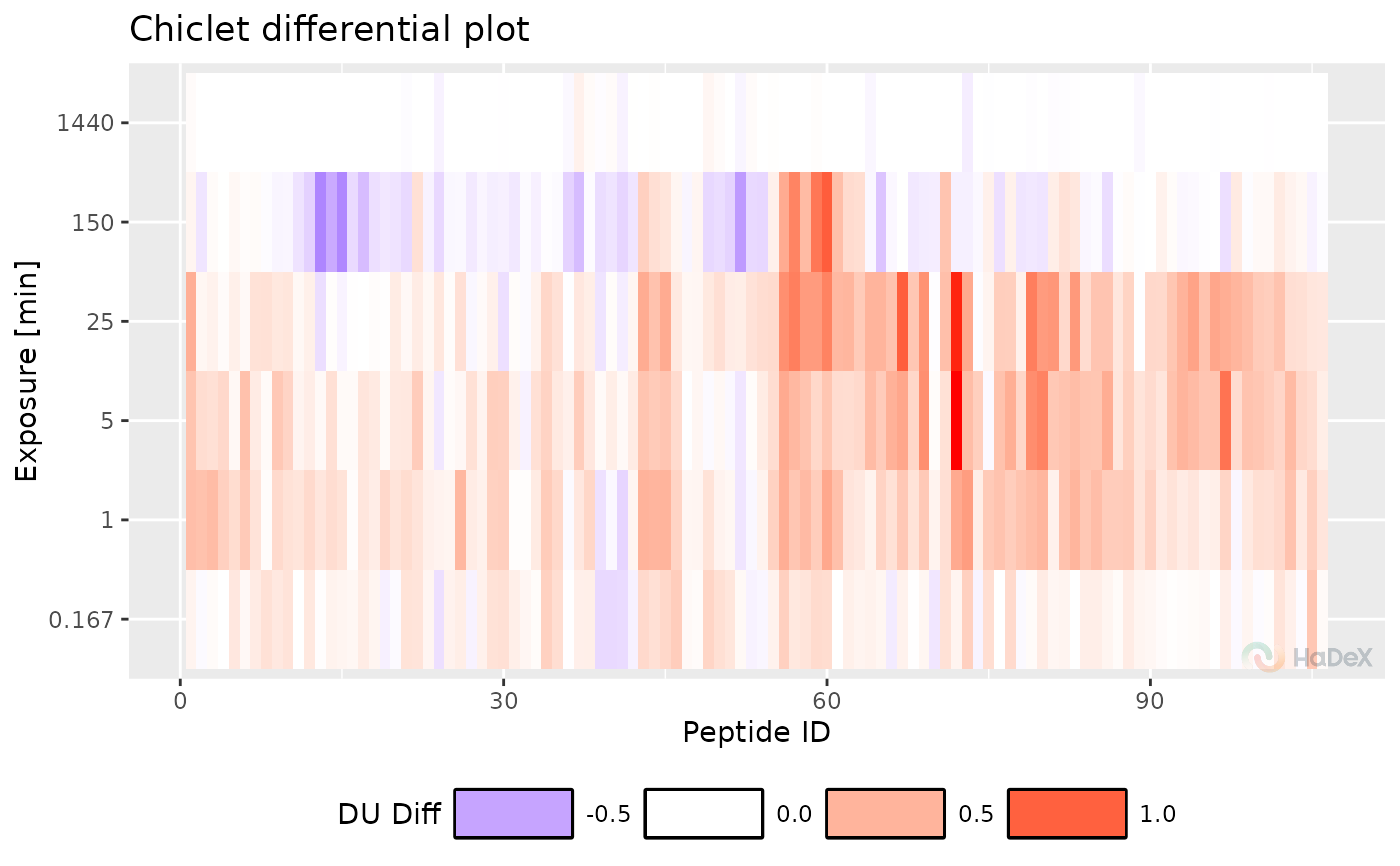
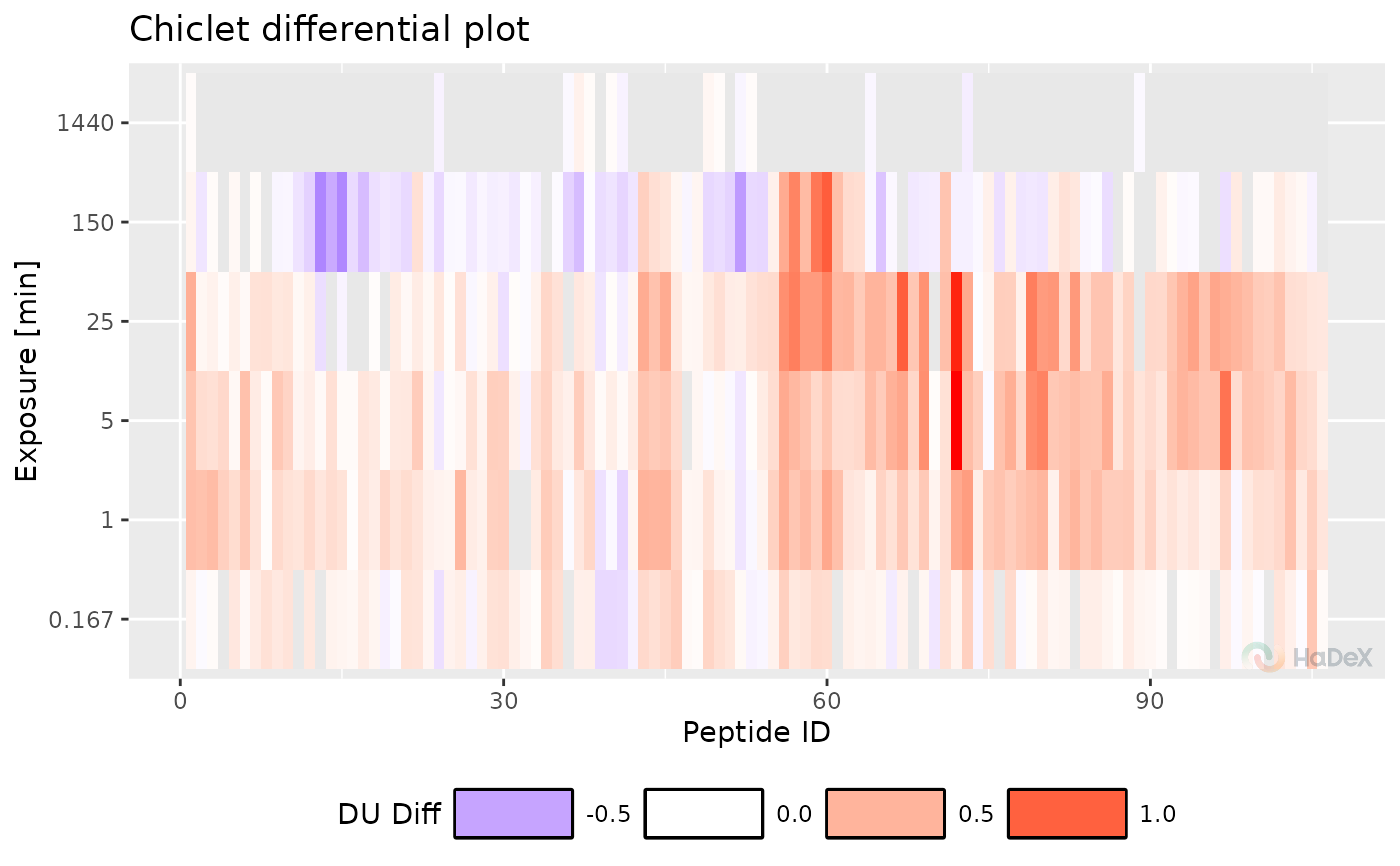
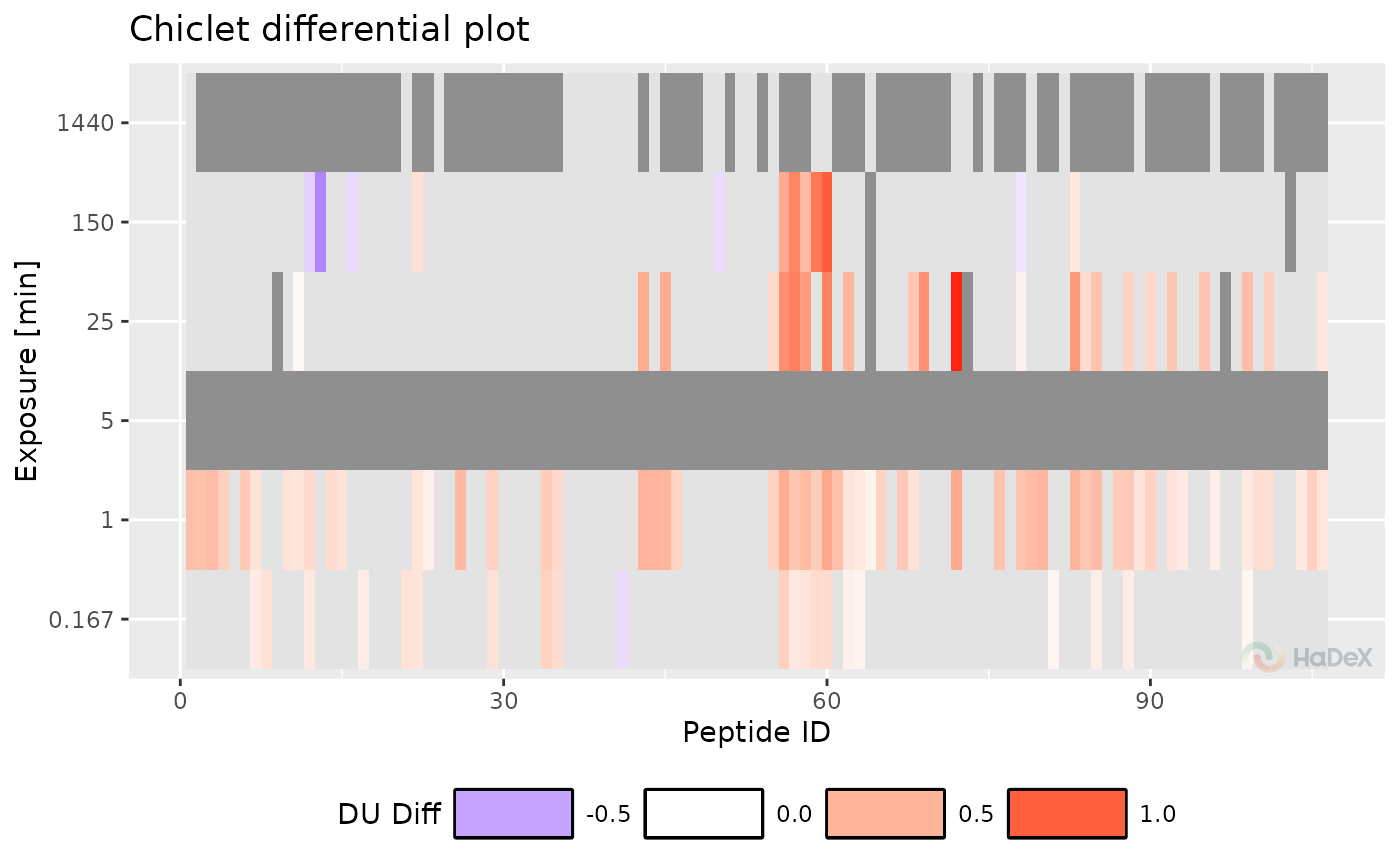
Function plot_differential_chiclet generates
chiclet differential plot based on provided data and parameters.
On X-axis there is a peptide ID. On Y-axis are time points
of measurement. Each tile for a peptide in time has a color value
representing the deuterium uptake difference between chosen states,
in a form based on provided criteria (e.q. fractional). Each tile has
a plus sign, which size represent the uncertainty of measurement for
chosen value.
Examples
diff_uptake_dat <- create_diff_uptake_dataset(alpha_dat)
plot_differential_chiclet(diff_uptake_dat)
 plot_differential_chiclet(diff_uptake_dat, show_houde_interval = TRUE)
 diff_p_uptake_dat <- create_p_diff_uptake_dataset(alpha_dat)
plot_differential_chiclet(diff_p_uptake_dat = diff_p_uptake_dat,
show_tstud_confidence = TRUE)
diff_p_uptake_dat <- create_p_diff_uptake_dataset(alpha_dat)
plot_differential_chiclet(diff_p_uptake_dat = diff_p_uptake_dat,
show_tstud_confidence = TRUE)
 plot_differential_chiclet(diff_p_uptake_dat = diff_p_uptake_dat,
show_tstud_confidence = TRUE, show_houde_interval = TRUE)
plot_differential_chiclet(diff_p_uptake_dat = diff_p_uptake_dat,
show_tstud_confidence = TRUE, show_houde_interval = TRUE)
