Plots aggregated uptake
plot_aggregated_uptake.RdPlots aggregated uptake
Arguments
- aggregated_dat
aggregated differential uptake data as calculated by
create_aggregated_uptake_dataset- fractional
logical, determines if values are fractional- theoretical
logical, determines if values are theoretical- time_100
maximal exchange control time point of measurement [min]
- panels
logical, indicator if plot should be divided into panels or not- interactive
logical, whether plot should have an interactive layer created with with ggiraph, which would add tooltips to the plot in an interactive display (HTML/Markdown documents or shiny app).
Value
a ggplot object
Examples
# \donttest{
# disabled due to long execution time
kin_dat <- create_uptake_dataset(alpha_dat, states = "Alpha_KSCN")
aggregated_dat <- create_aggregated_uptake_dataset(kin_dat)
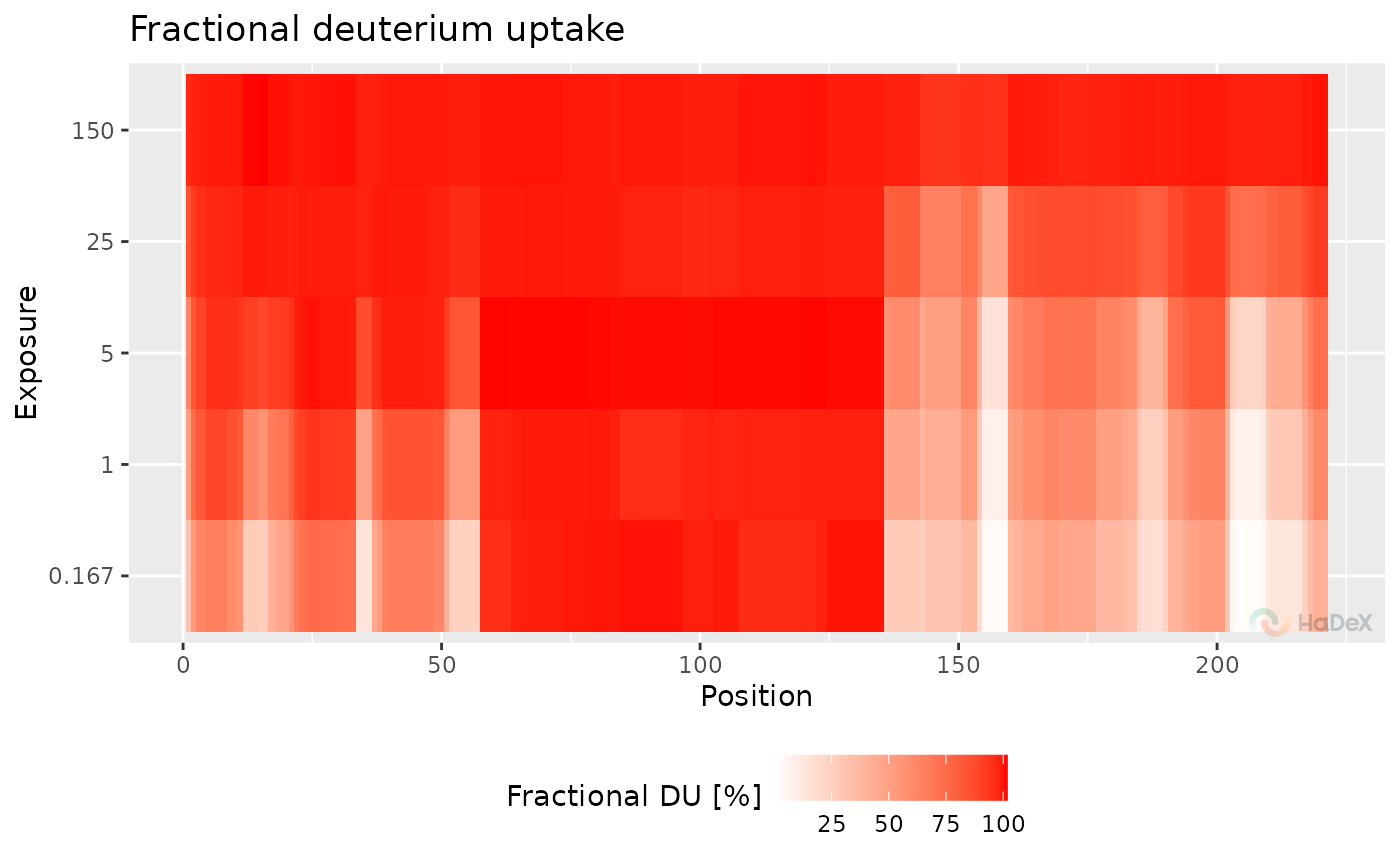
plot_aggregated_uptake(aggregated_dat, panels = FALSE)
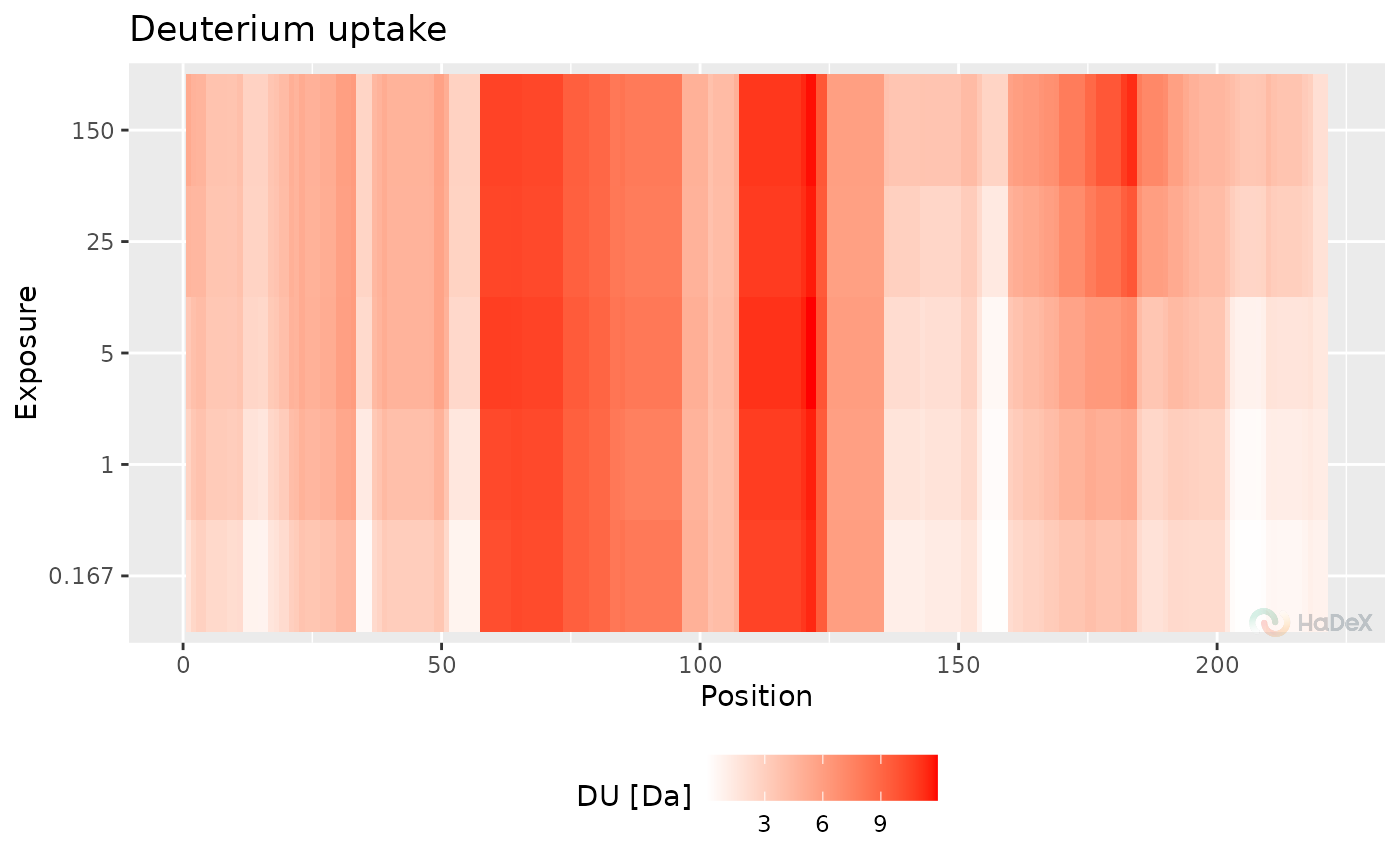
 plot_aggregated_uptake(aggregated_dat, fractional = FALSE, panels = FALSE)
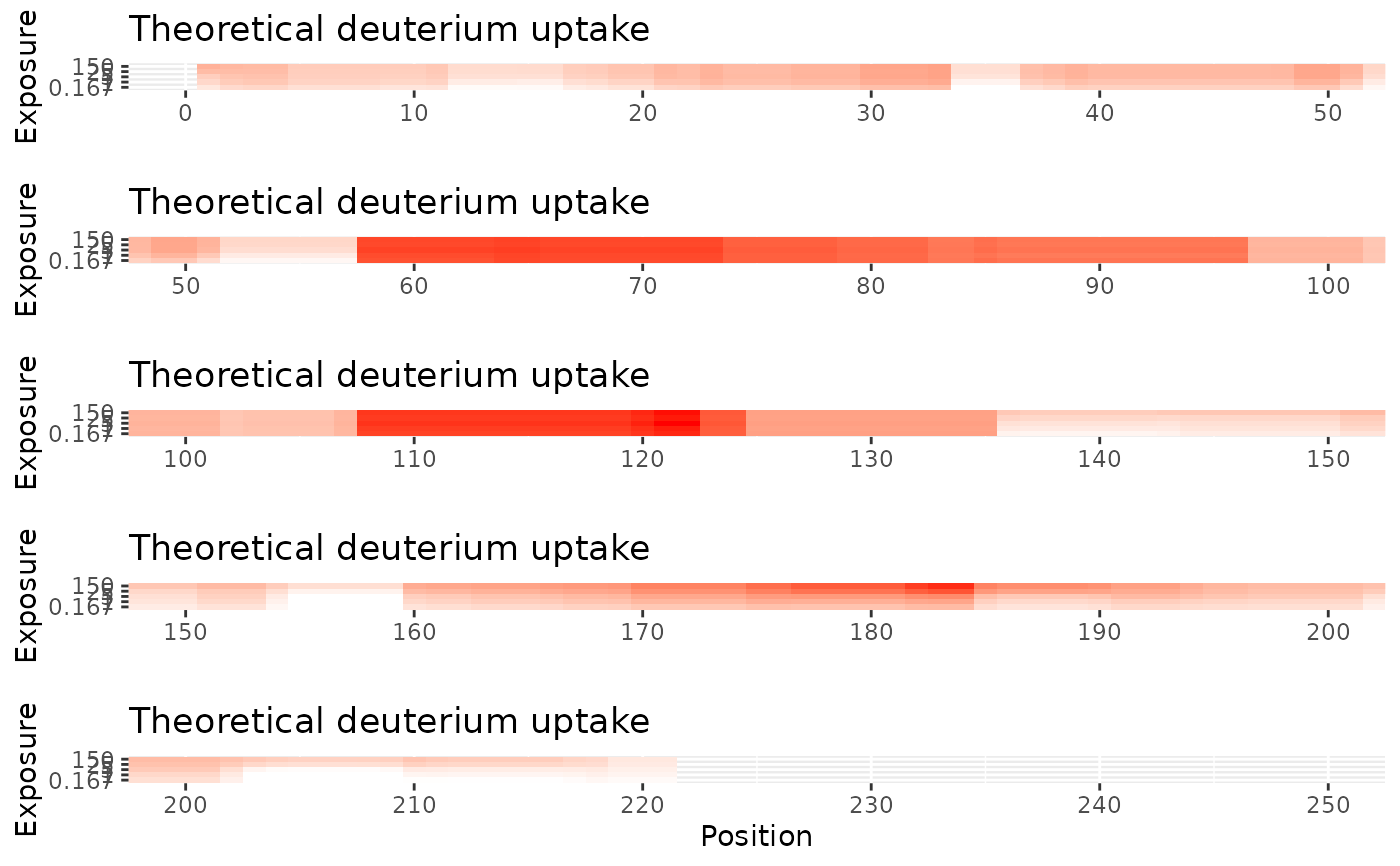
 plot_aggregated_uptake(aggregated_dat, fractional = FALSE, theoretical = TRUE, panels = TRUE)
 #> NULL
# }
#> NULL
# }