Plots initial fit parameters
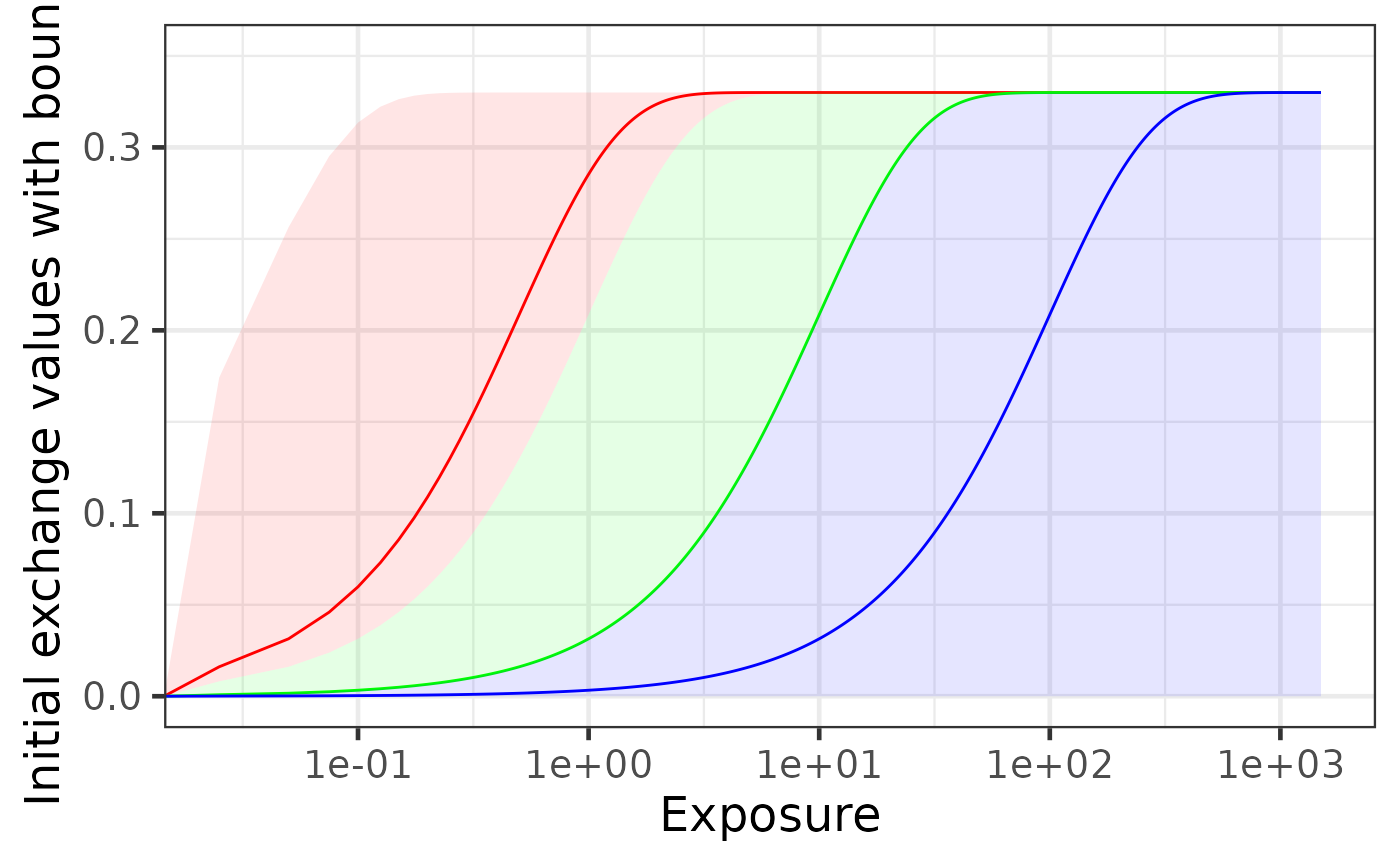
plot_start_params.RdPlots a visualization of selected excahnge group limits, with initial parameters for the fit. It is helpful for additional self-control of chosen limits.
Examples
fit_k_params <- get_example_fit_k_params()
plot_start_params(fit_k_params)
#> Warning: log-10 transformation introduced infinite values.
#> Warning: log-10 transformation introduced infinite values.
#> Warning: log-10 transformation introduced infinite values.
#> Warning: log-10 transformation introduced infinite values.
#> Warning: log-10 transformation introduced infinite values.
#> Warning: log-10 transformation introduced infinite values.