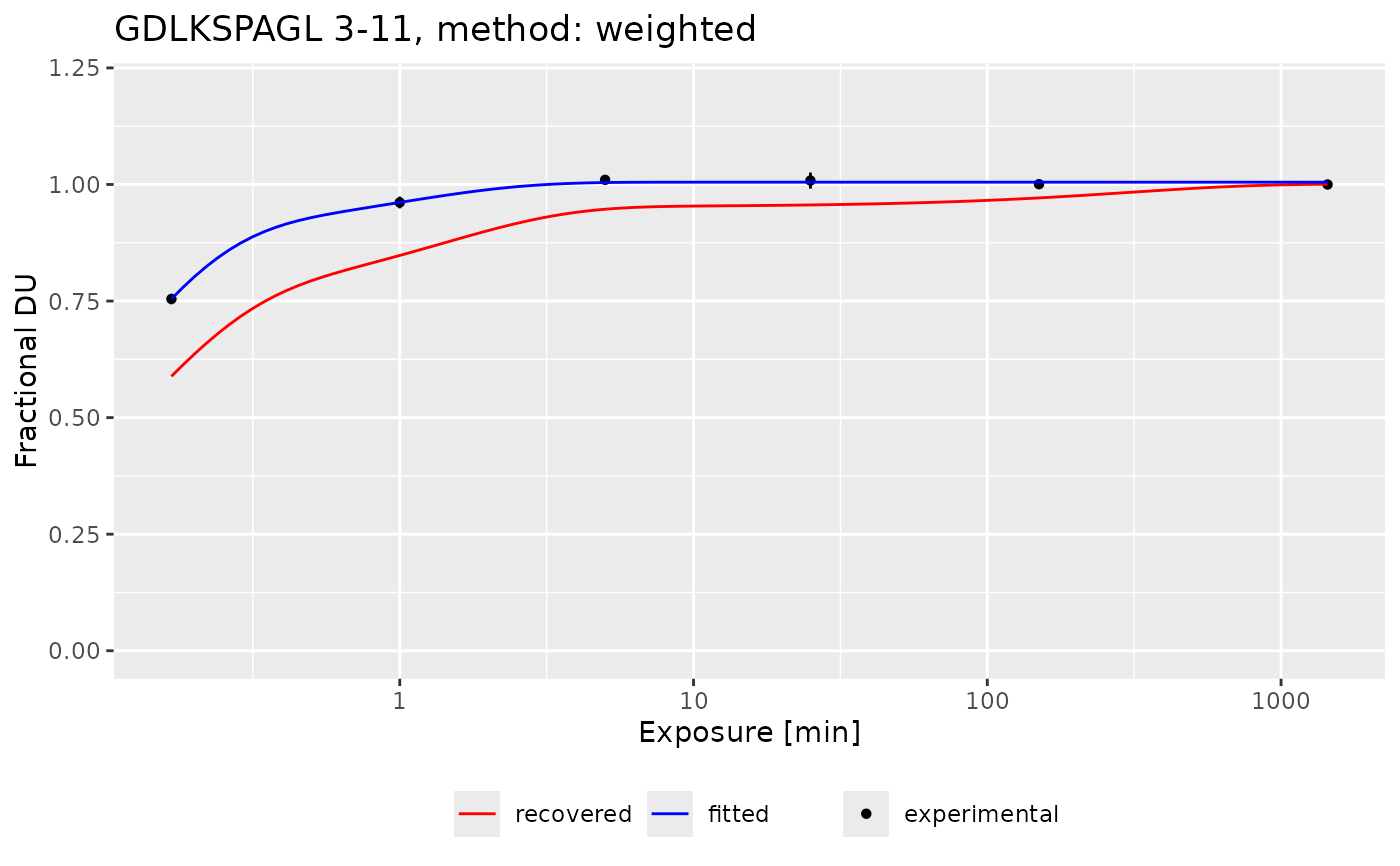
Plot recovered values among experimental ones
plot_recreated_uc.RdPlot recovered values among experimental ones
Usage
plot_recreated_uc(
  fit_dat,
  fit_values,
  recreated_fit_values,
  hires_method = "weighted",
  fractional = TRUE,
  interactive = FALSE,
  if_girafe = FALSE
)
Examples
kin_dat <- prepare_kin_dat(alpha_dat, state = "Alpha_KSCN")
fit_dat <- kin_dat[kin_dat[["ID"]]==3, ]
fit_values_all <- create_fit_dataset(kin_dat, control = get_example_control(),
                                     fit_k_params = get_example_fit_k_params(),
                                     fractional = TRUE)
fit_values <- fit_values_all[fit_values_all[["id"]]==3, ]
hires_dat <- calculate_hires(fit_values = fit_values_all, method = "weighted", fractional = TRUE)
recreated_fit_values <- recreate_fit_values(peptide_sequence = "GFGDLKSPAGL",
                                            peptide_start = 1, peptide_end = 11,
                                            hires_dat = hires_dat)
plot_recreated_uc(fit_dat, fit_values, recreated_fit_values)
#> Warning: All aesthetics have length 1, but the data has 6 rows.
#> ℹ Please consider using `annotate()` or provide this layer with data containing
#>   a single row.
#> Warning: All aesthetics have length 1, but the data has 6 rows.
#> ℹ Please consider using `annotate()` or provide this layer with data containing
#>   a single row.