Plots recovered DU rmse
plot_recovered_uc_coverage.RdFunction plots the rmse of recovered deuterium uptake from high-resolution parameters with respect to the experimental deuterium uptake, calculated for whole peptide. There are two possible plotting methods:
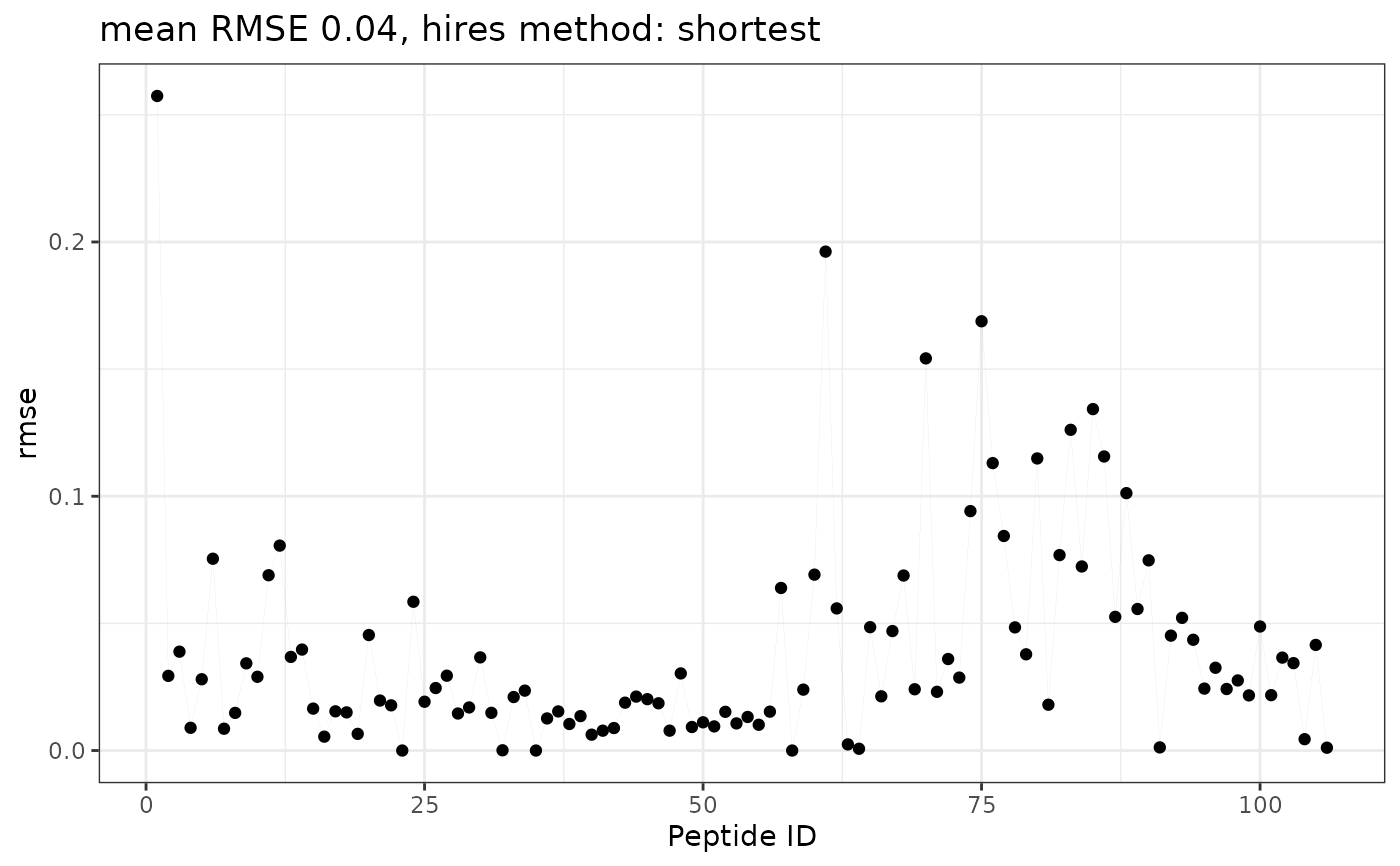
butterfly: with peptide ID values on the X-axis and RMSE values on the Y-axis
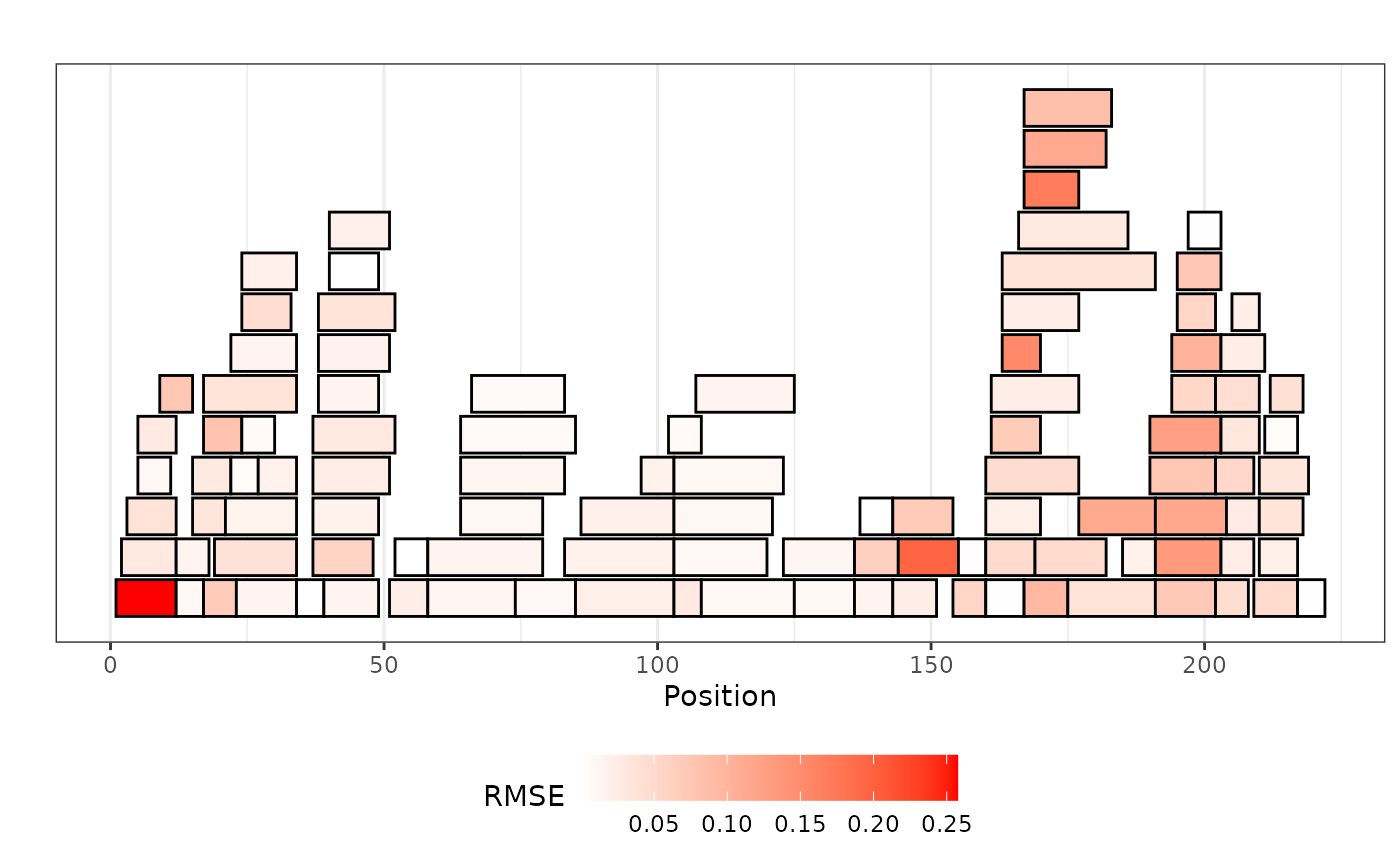
coverage: in the form of coverage plot with fill color showing the RMSE value. This function plots the results only for one aggregation method. For the comparison of aggregation methods see: compare_aggregation_methods.
Usage
plot_recovered_uc_coverage(rec_uc_rmse_dat, style = c("coverage", "butterfly"))Examples
kin_dat <- prepare_kin_dat(alpha_dat, state = "Alpha_KSCN")
fit_values_all <- create_fit_dataset(kin_dat, control = get_example_control(),
                                     fit_k_params = get_example_fit_k_params(),
                                     fractional = T)
rec_uc_dat <- create_uc_from_hires_dataset(kin_dat,
                                           fit_values_all,
                                           hires_method = "shortest")
rec_uc_rmse_dat <- calculate_recovered_uc_rmse(rec_uc_dat, sort = "ID")
plot_recovered_uc_coverage(rec_uc_rmse_dat, style = "butterfly")

plot_recovered_uc_coverage(rec_uc_rmse_dat, style = "coverage")