Plots uptake curve with fit components
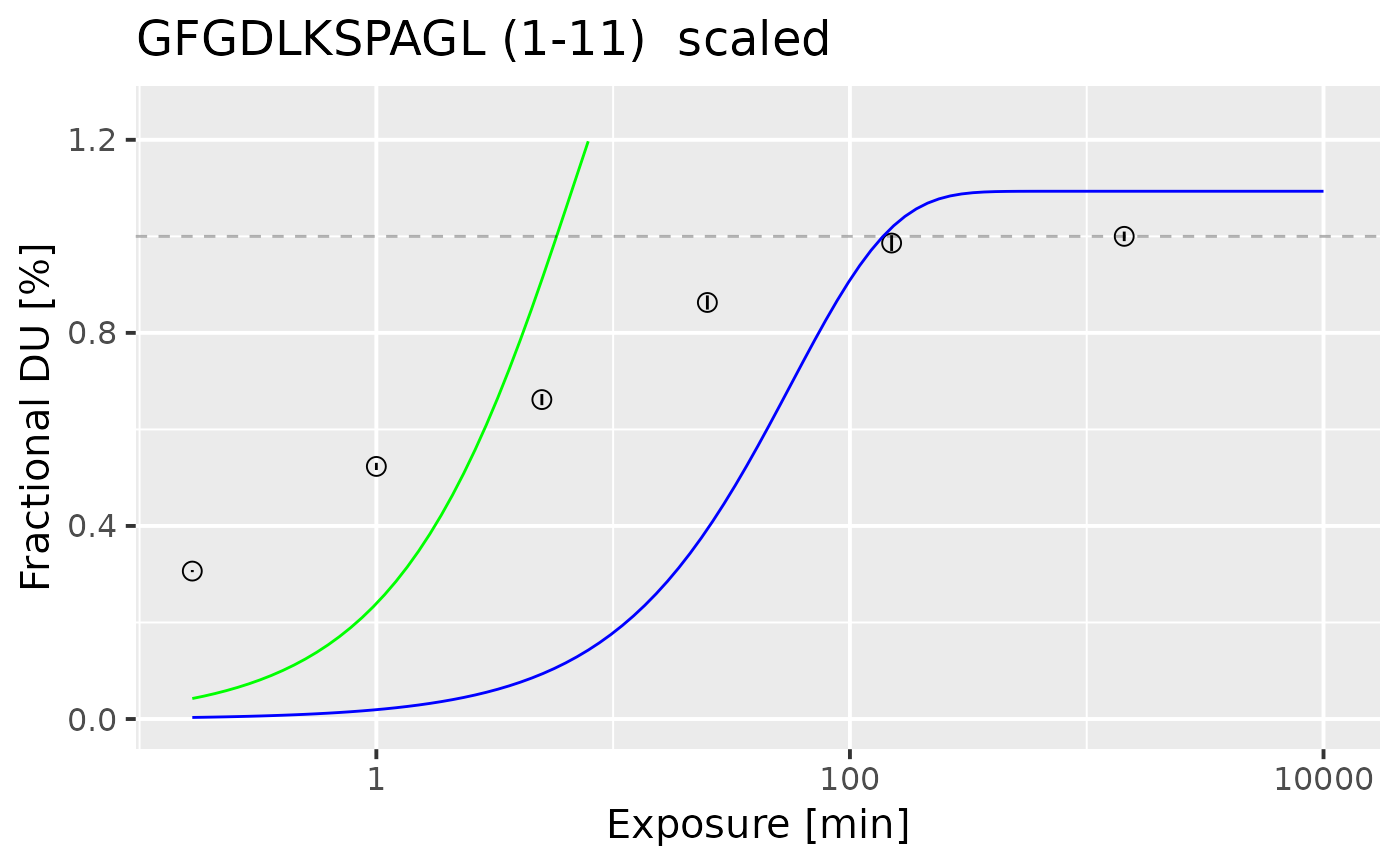
plot_fitted_uc.RdFUnction plots the uptake values for one, selected peptide. Alongside the fitted model is plotted in black, with its components (fast - red, medium - green, slow - blue). In case when peptide is classified as a edge case, the linear model is used.
Usage
plot_fitted_uc(
  fit_dat,
  fit_values,
  replicate = FALSE,
  fractional = TRUE,
  interactive = FALSE
)Examples
kin_dat <- prepare_kin_dat(alpha_dat)
fit_dat <- kin_dat[kin_dat[["ID"]]==1, ]
fit_k_params <- get_example_fit_k_params()
control <- get_example_control()
fit_values_all <- create_fit_dataset(kin_dat, fit_k_params, control)
fit_values <- fit_values_all[fit_values_all[["id"]]==1, ]
plot_fitted_uc(fit_dat, fit_values)
#> Warning: Removed 101 rows containing missing values or values outside the scale range
#> (`geom_function()`).
#> Warning: Removed 101 rows containing missing values or values outside the scale range
#> (`geom_function()`).
#> Warning: Removed 65 rows containing missing values or values outside the scale range
#> (`geom_function()`).