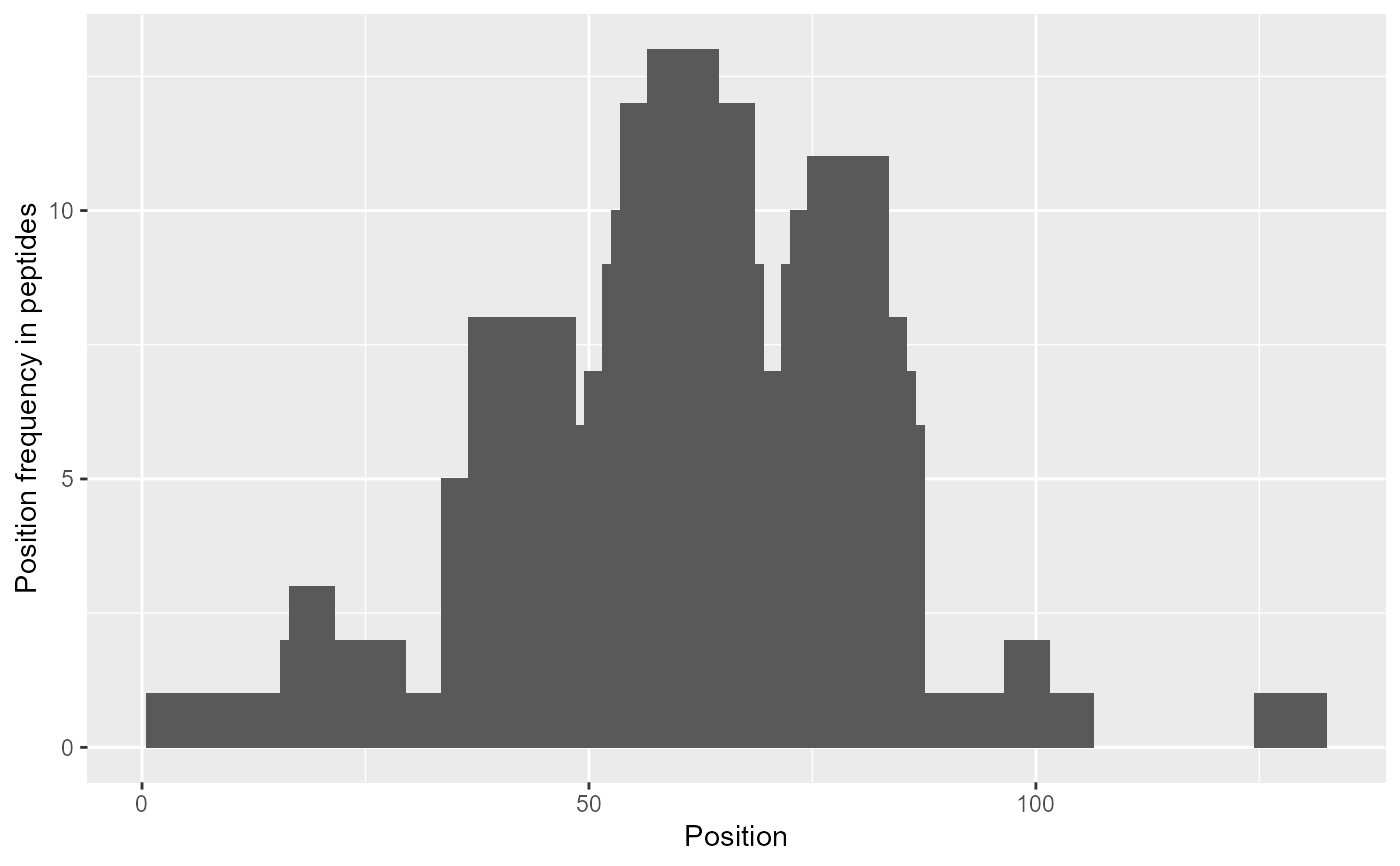
Plot position frequency
plot_position_frequency.RdPlots the frequency of coverage of protein sequence.
plot_position_frequency(
  dat,
  protein = dat[["Protein"]][1],
  chosen_state = dat[["State"]][1]
)
Arguments
| dat | data as imported by the |
|---|---|
| protein | protein to be included in plot |
| chosen_state | sequence states to be included in plot |
Value
a ggplot object.
Details
The function plot_position_frequency plots a histogram of the coverage frequency based on experimental data.
The aim of this plot is to see how many times each position of the sequence was covered (by different peptides).
See also
Examples
# load example data dat <- read_hdx(system.file(package = "HaDeX", "HaDeX/data/KD_180110_CD160_HVEM.csv")) # function call with default parameters plot_position_frequency(dat)# function call with explicit parameters plot_position_frequency(dat, chosen_state = "CD160_HVEM")