Plot peptide coverage
plot_coverage.RdPlots the peptide coverage of the protein sequence.
plot_coverage(
  dat,
  protein = dat[["Protein"]][1],
  chosen_state = dat[["State"]][1]
)
Arguments
| dat | data as imported by the |
|---|---|
| protein | protein to be included in plot |
| chosen_state | sequence states to be included in plot |
Value
a ggplot object.
Details
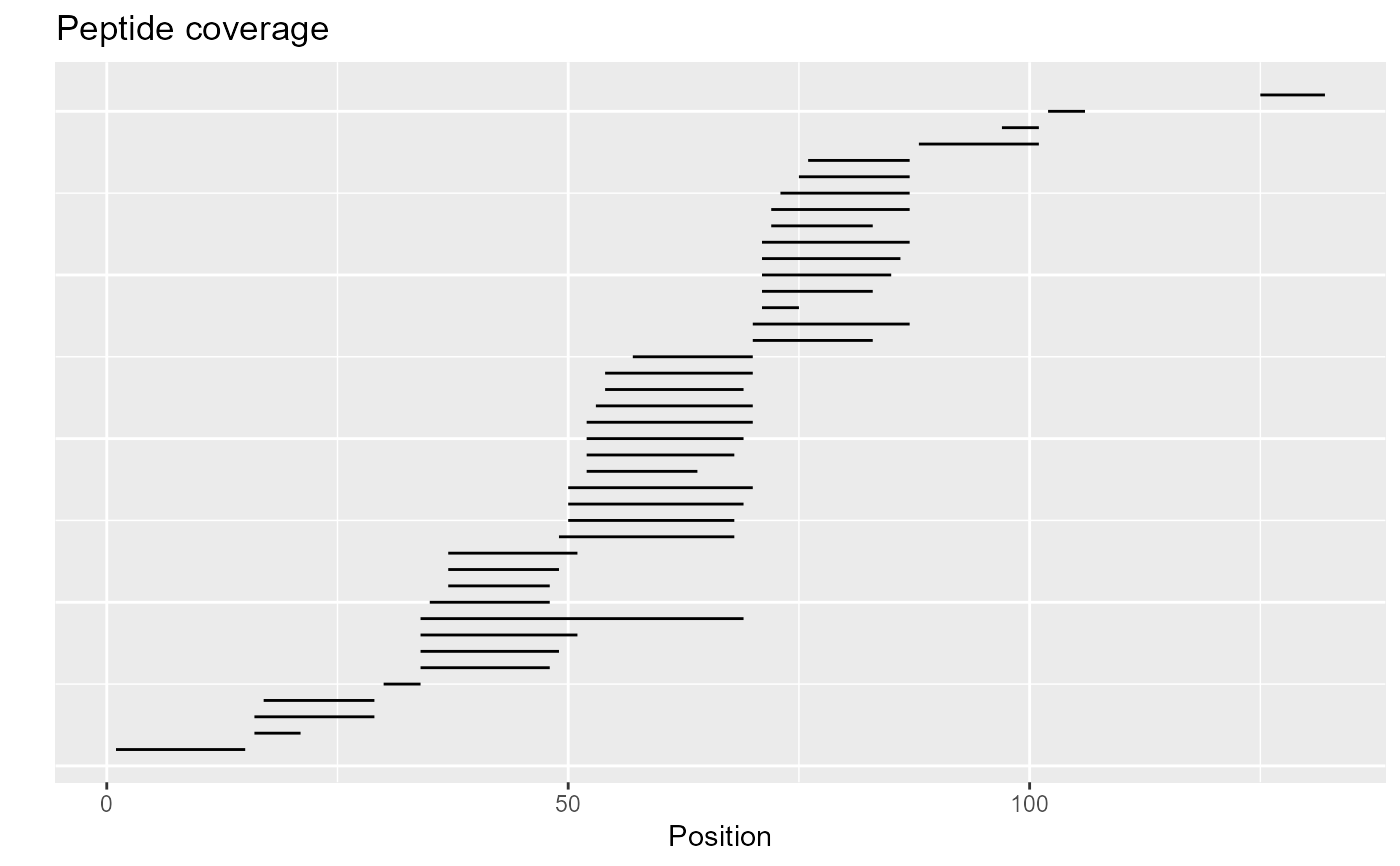
The function plot_coverage plots sequence coverage based on experimental data for chosen protein in chosen state.
Only non-duplicated peptides are shown on the plot, next to each other.
The aim of this plot is to see the dependence between positions of the peptides on the protein sequence. Their position in y-axis does not contain any information.
See also
Examples
# load example data dat <- read_hdx(system.file(package = "HaDeX", "HaDeX/data/KD_180110_CD160_HVEM.csv")) # plot coverage with default parameters plot_coverage(dat)# plot coverage with explicit parameters plot_coverage(dat, protein = "db_CD160", chosen_state = "CD160_HVEM")