Data aggregation
transformation.RmdThe aggregation of the data is complex. This article describes the process step by step for a better understanding of the data transformation.
Aggregation of the data - visualization
Let’s see how the data is transformed. We will use the example file “KD_180110_CD160_HVEM.csv” from the HaDeX package and focus on just one peptide - “LCKDRSGDCSPETSLKQLRLKRDPGIDGVGEISSQL” in the state “CD160”. The measurement was made for timepoint 1 min.
Below is shown the original and unaggregated data for chosen peptide.
## Protein Start End Sequence Modification
## 1: db_CD160 34 69 LCKDRSGDCSPETSLKQLRLKRDPGIDGVGEISSQL NA
## 2: db_CD160 34 69 LCKDRSGDCSPETSLKQLRLKRDPGIDGVGEISSQL NA
## 3: db_CD160 34 69 LCKDRSGDCSPETSLKQLRLKRDPGIDGVGEISSQL NA
## 4: db_CD160 34 69 LCKDRSGDCSPETSLKQLRLKRDPGIDGVGEISSQL NA
## 5: db_CD160 34 69 LCKDRSGDCSPETSLKQLRLKRDPGIDGVGEISSQL NA
## 6: db_CD160 34 69 LCKDRSGDCSPETSLKQLRLKRDPGIDGVGEISSQL NA
## 7: db_CD160 34 69 LCKDRSGDCSPETSLKQLRLKRDPGIDGVGEISSQL NA
## 8: db_CD160 34 69 LCKDRSGDCSPETSLKQLRLKRDPGIDGVGEISSQL NA
## 9: db_CD160 34 69 LCKDRSGDCSPETSLKQLRLKRDPGIDGVGEISSQL NA
## 10: db_CD160 34 69 LCKDRSGDCSPETSLKQLRLKRDPGIDGVGEISSQL NA
## 11: db_CD160 34 69 LCKDRSGDCSPETSLKQLRLKRDPGIDGVGEISSQL NA
## 12: db_CD160 34 69 LCKDRSGDCSPETSLKQLRLKRDPGIDGVGEISSQL NA
## 13: db_CD160 34 69 LCKDRSGDCSPETSLKQLRLKRDPGIDGVGEISSQL NA
## 14: db_CD160 34 69 LCKDRSGDCSPETSLKQLRLKRDPGIDGVGEISSQL NA
## 15: db_CD160 34 69 LCKDRSGDCSPETSLKQLRLKRDPGIDGVGEISSQL NA
## 16: db_CD160 34 69 LCKDRSGDCSPETSLKQLRLKRDPGIDGVGEISSQL NA
## 17: db_CD160 34 69 LCKDRSGDCSPETSLKQLRLKRDPGIDGVGEISSQL NA
## 18: db_CD160 34 69 LCKDRSGDCSPETSLKQLRLKRDPGIDGVGEISSQL NA
## 19: db_CD160 34 69 LCKDRSGDCSPETSLKQLRLKRDPGIDGVGEISSQL NA
## 20: db_CD160 34 69 LCKDRSGDCSPETSLKQLRLKRDPGIDGVGEISSQL NA
## Fragment MaxUptake MHP State Exposure File z
## 1: NA 33 3900.991 CD160 1 KD_160530_CD160_1min_01 3
## 2: NA 33 3900.991 CD160 1 KD_160530_CD160_1min_01 4
## 3: NA 33 3900.991 CD160 1 KD_160530_CD160_1min_01 5
## 4: NA 33 3900.991 CD160 1 KD_160530_CD160_1min_01 6
## 5: NA 33 3900.991 CD160 1 KD_160530_CD160_1min_01 7
## 6: NA 33 3900.991 CD160 1 KD_160530_CD160_1min_02 3
## 7: NA 33 3900.991 CD160 1 KD_160530_CD160_1min_02 4
## 8: NA 33 3900.991 CD160 1 KD_160530_CD160_1min_02 5
## 9: NA 33 3900.991 CD160 1 KD_160530_CD160_1min_02 6
## 10: NA 33 3900.991 CD160 1 KD_160530_CD160_1min_02 7
## 11: NA 33 3900.991 CD160 1 KD_160530_CD160_1min_03 3
## 12: NA 33 3900.991 CD160 1 KD_160530_CD160_1min_03 4
## 13: NA 33 3900.991 CD160 1 KD_160530_CD160_1min_03 5
## 14: NA 33 3900.991 CD160 1 KD_160530_CD160_1min_03 6
## 15: NA 33 3900.991 CD160 1 KD_160530_CD160_1min_03 7
## 16: NA 33 3900.991 CD160 1 KD_160530_CD160_1min_04 3
## 17: NA 33 3900.991 CD160 1 KD_160530_CD160_1min_04 4
## 18: NA 33 3900.991 CD160 1 KD_160530_CD160_1min_04 5
## 19: NA 33 3900.991 CD160 1 KD_160530_CD160_1min_04 6
## 20: NA 33 3900.991 CD160 1 KD_160530_CD160_1min_04 7
## RT Inten Center
## 1: 4.524763 325032 1307.8329
## 2: 4.524404 753259 981.0960
## 3: 4.523707 1340447 785.0905
## 4: 4.524032 2076956 654.3858
## 5: 4.525778 759271 561.0548
## 6: 4.522330 239810 1307.7777
## 7: 4.521255 583325 981.0817
## 8: 4.521919 1011160 785.0811
## 9: 4.521726 1584254 654.4194
## 10: 4.522196 600218 561.0268
## 11: 4.523605 176788 1307.8942
## 12: 4.524804 402630 981.1597
## 13: 4.521938 746309 785.0906
## 14: 4.522238 1117344 654.4344
## 15: 4.524647 397718 561.0833
## 16: 4.531138 189258 1307.8739
## 17: 4.530608 441817 981.1656
## 18: 4.528928 796722 785.1220
## 19: 4.530066 1186263 654.4411
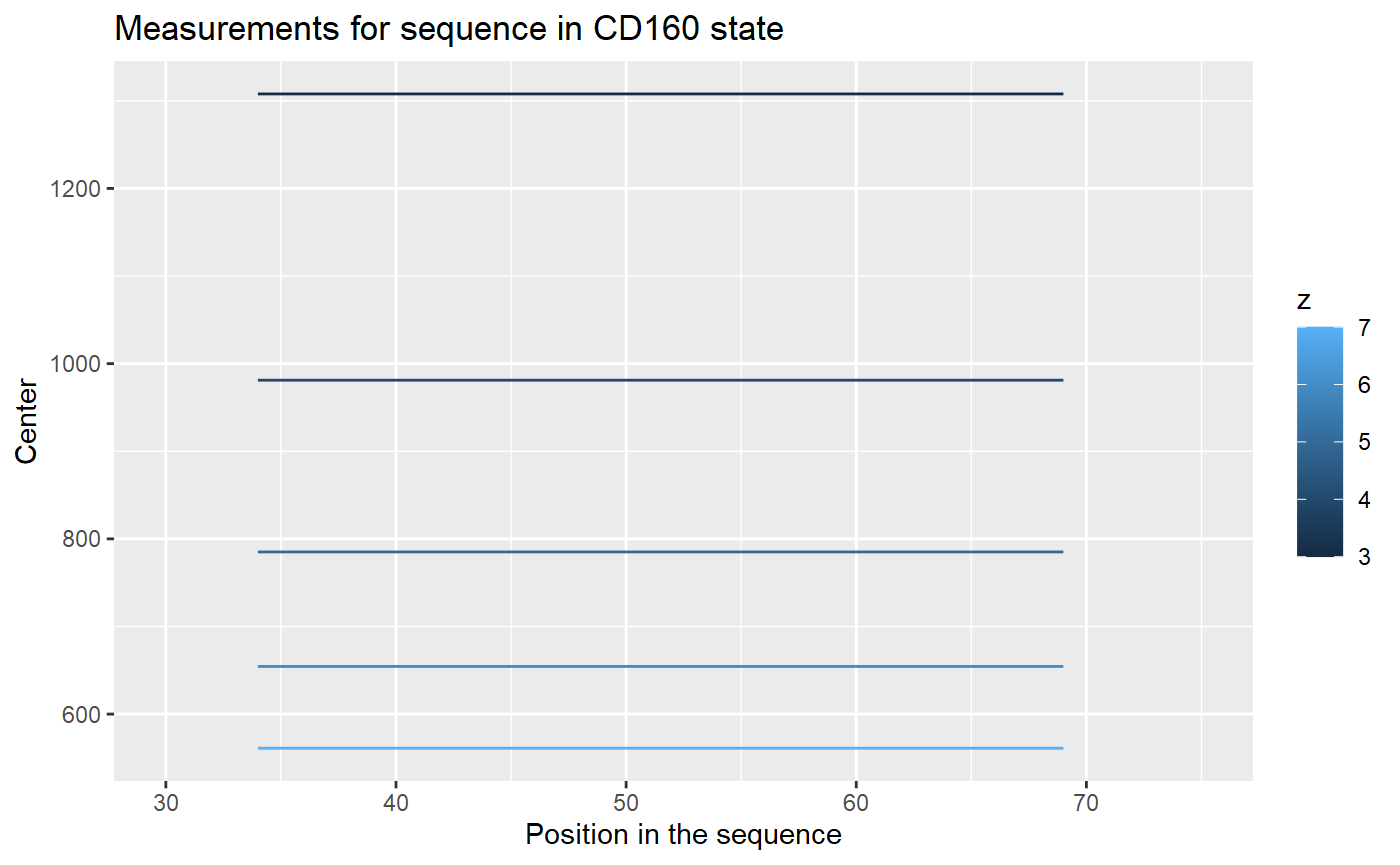
## 20: 4.531333 451071 561.0588As we can see from the File column, there are four replicates of the experiment. Each measurement of a replicate provide values for different possible charge values for each peptide. The result of a measurement is in column Center - this is a geometrical centroid of an isotopic envelope - the product of the measurement from a mass spectrometer.
Let’s take a look for values for each replicate.
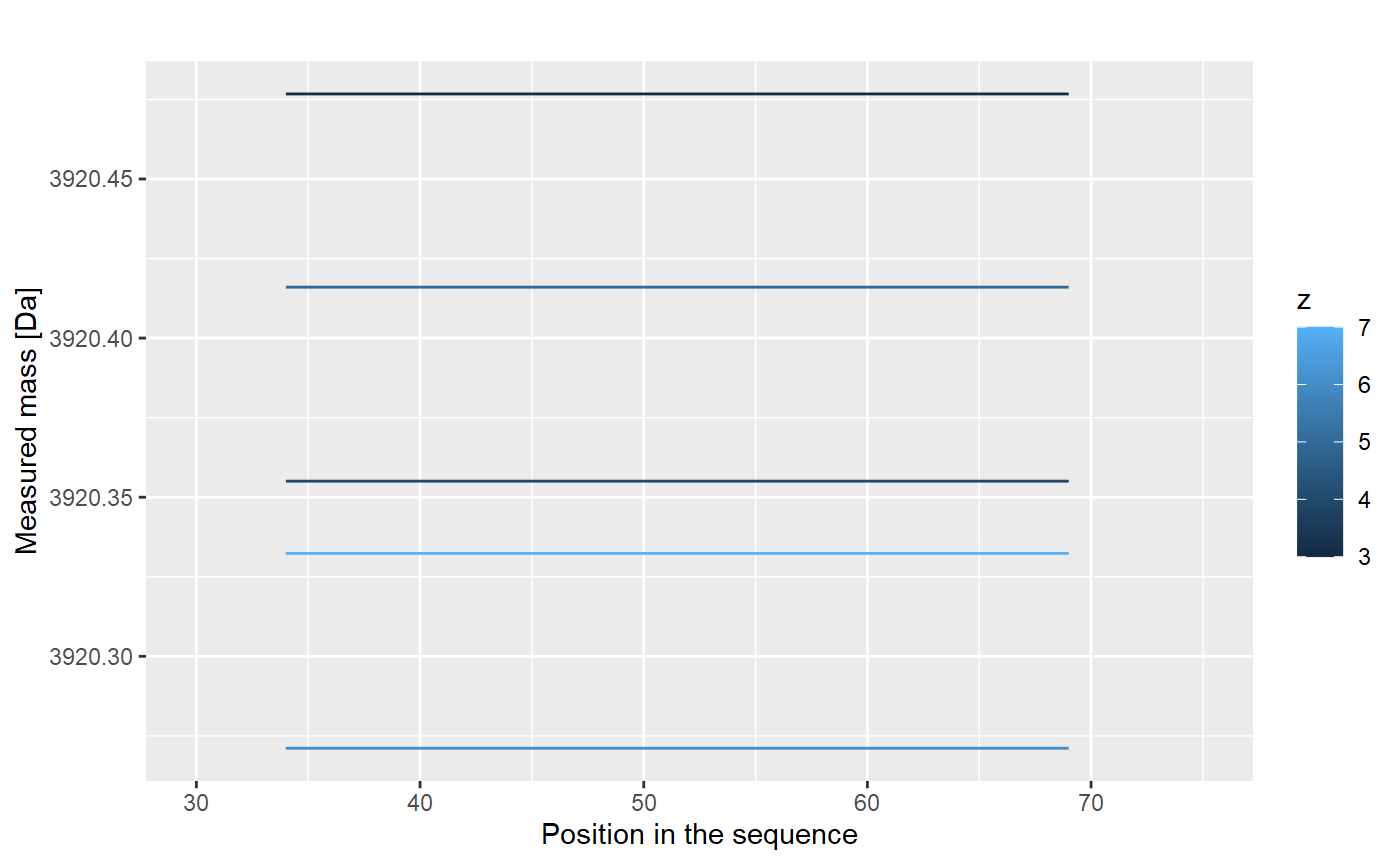
The centroid values for different charge values are not useful. We have to transform it to the mass values, according to an equation:
\[ aggMass = z*(Center - protonMass)\] The results are shown below.
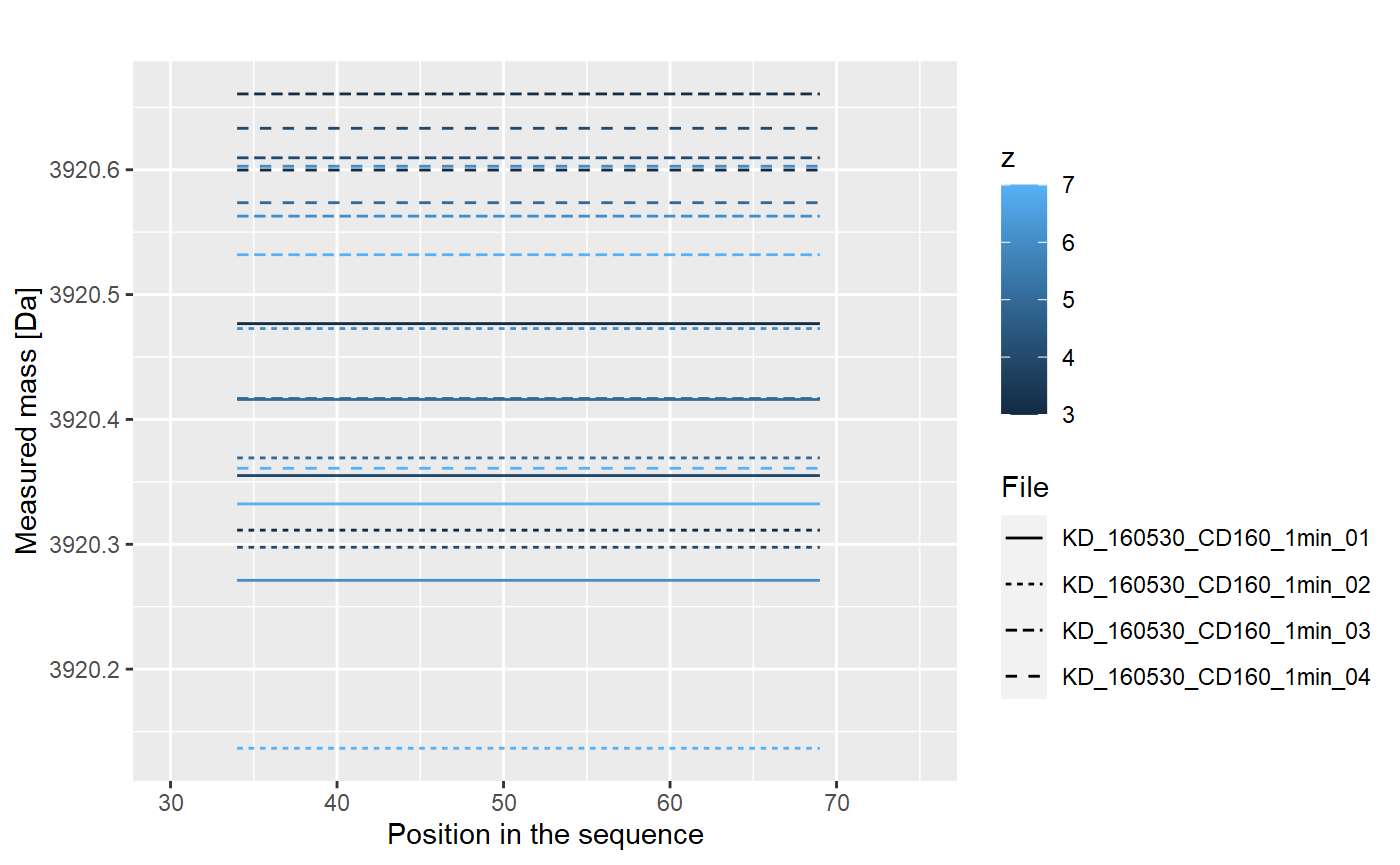
This results are just for one repetition. We have four of them:
Values from each replicate are aggregated into one value, using weighted mean (with intencity value as weight):
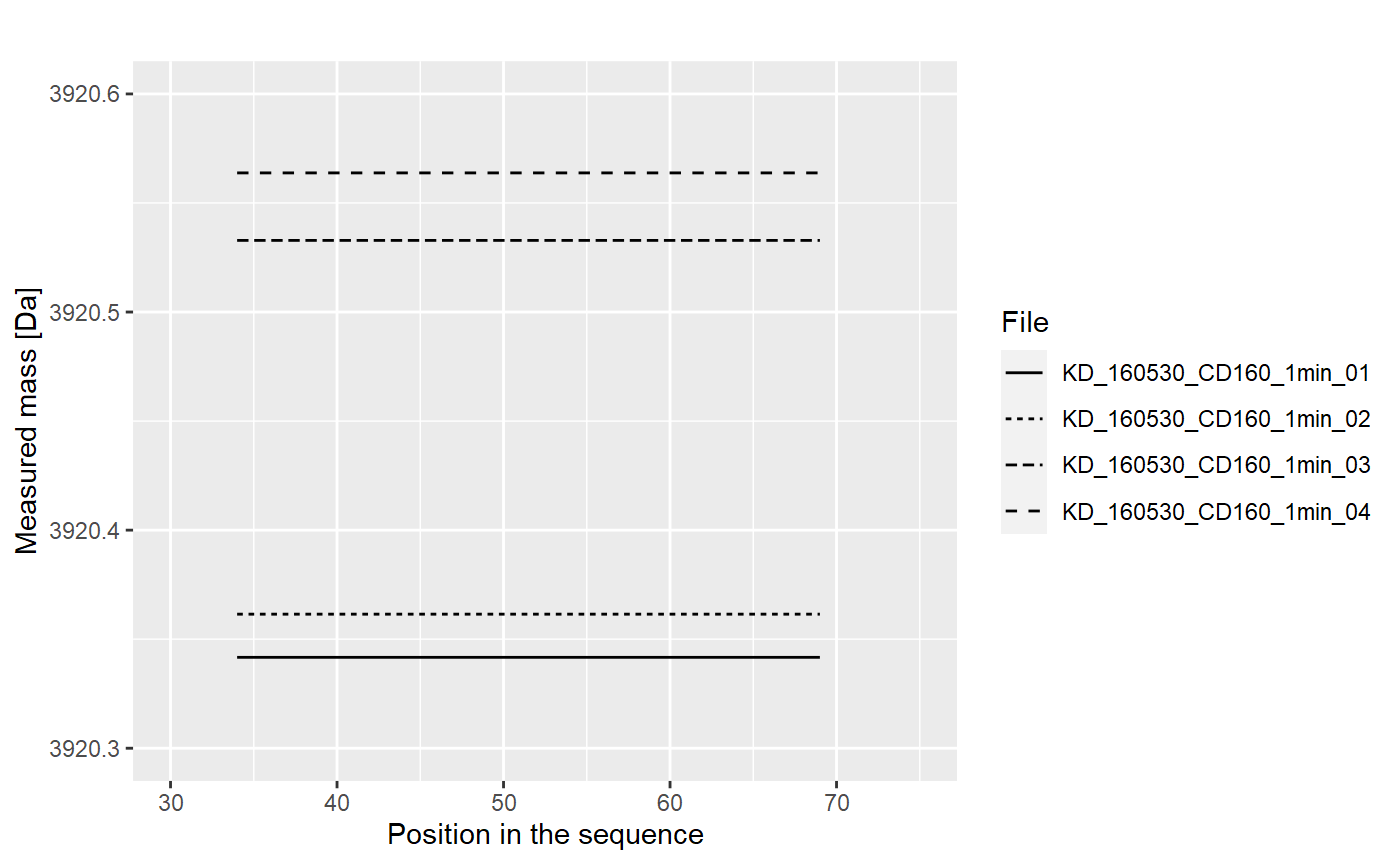
The results from replicates are aggregated into the final result (mean), and the uncertainty (standard deviation of the mean) is calculated.
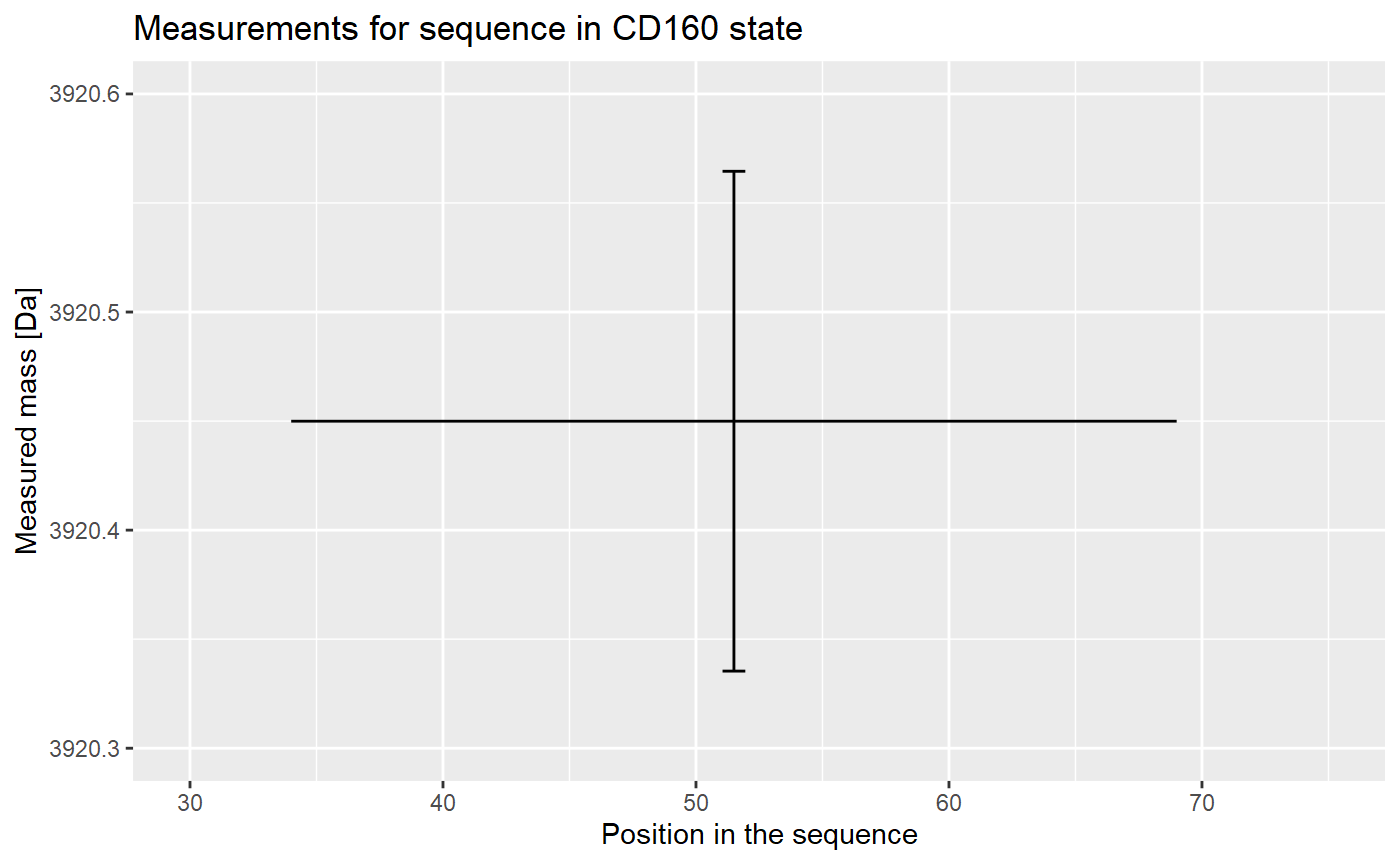
Now we have the mass value for chosen peptide in the chosen state, measured in the chosen time point. This calculation is done for every other peptide, and these values of mass and uncertainty are used in the calculation of deuterium uptake, as described in the Data processing article.