Plot kinetics data
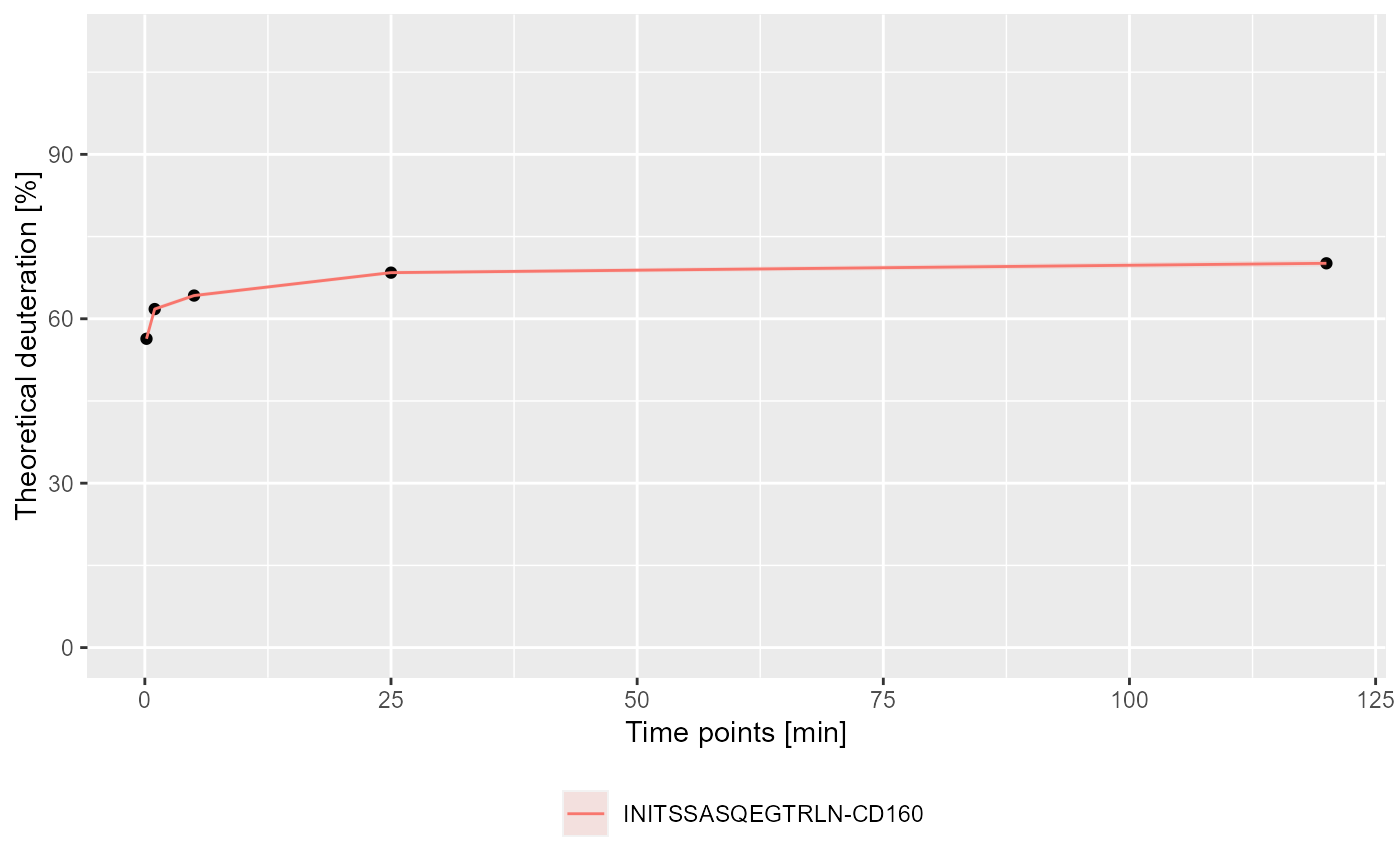
plot_kinetics.RdPlots kinetics of the hydrogen-deuterium exchange for specific peptides.
plot_kinetics(kin_dat, theoretical = FALSE, relative = TRUE)
Arguments
| kin_dat | calculated kinetic data by |
|---|---|
| theoretical |
|
| relative |
|
Value
a ggplot object.
Details
This function visualises the output of the
calculate_kinetics function.
Based on supplied parameters appropriate columns are chosen for the plot.
The uncertainty associated with each peptide is shown as a ribbon.
Axis are labeled according to the supplied parameters but no title is provided.
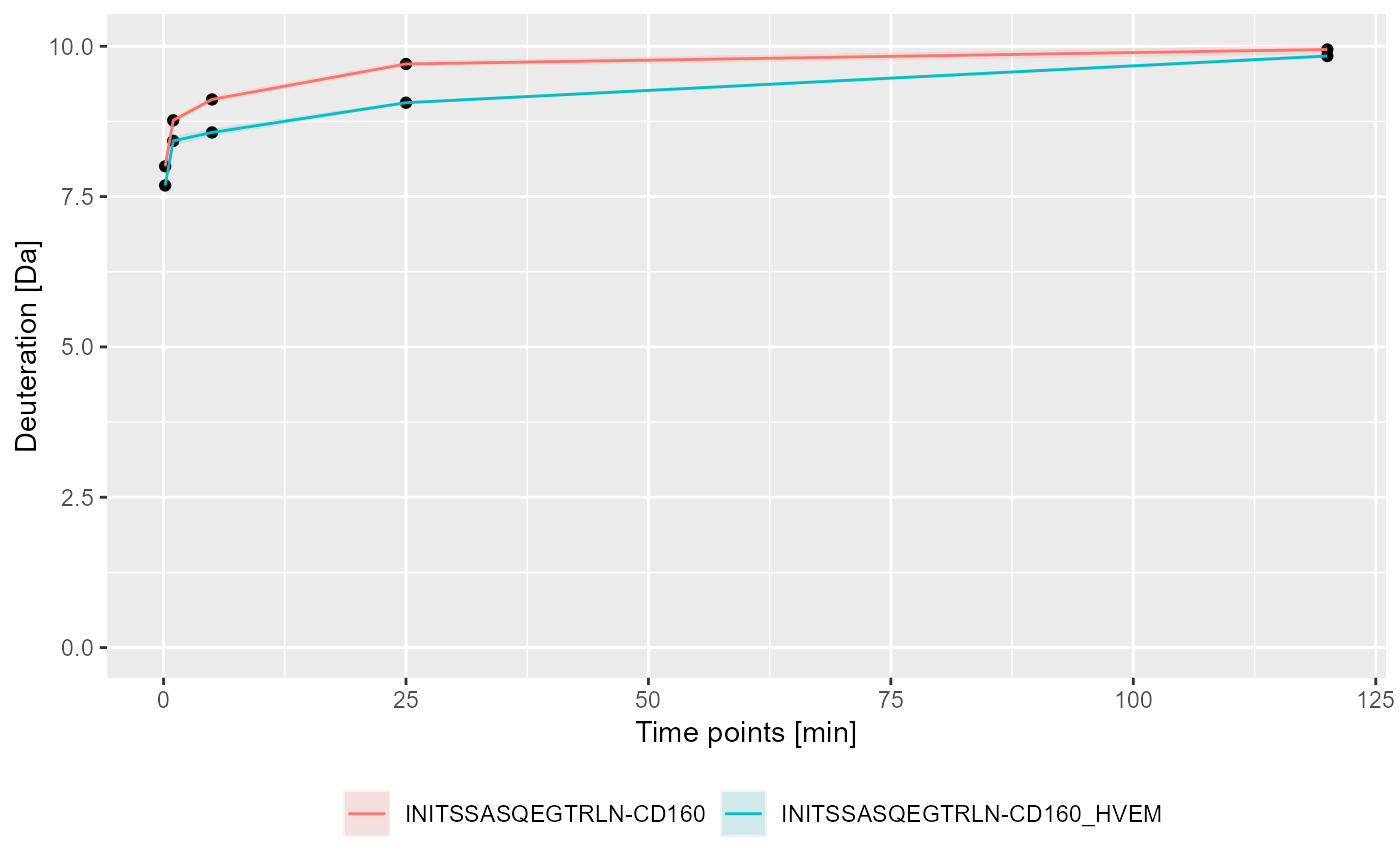
If you want to plot data for more then one peptide in one state, join
calculated data by using bind_rows from dplyr package and
pass the result as kin_dat.
See also
Examples
# load example data dat <- read_hdx(system.file(package = "HaDeX", "HaDeX/data/KD_180110_CD160_HVEM.csv")) # calculate data for the sequence INITSSASQEGTRLN in the CD160 state (kin1 <- calculate_kinetics(dat, protein = "db_CD160", sequence = "INITSSASQEGTRLN", state = "CD160", start = 1, end = 15, time_in = 0.001, time_out = 1440))#> # A tibble: 5 x 15 #> Protein Sequence Start End State time_chosen frac_exch_state #> <chr> <chr> <int> <int> <chr> <dbl> <dbl> #> 1 db_CD1~ INITSSA~ 1 15 CD160 0.167 76.9 #> 2 db_CD1~ INITSSA~ 1 15 CD160 1 84.2 #> 3 db_CD1~ INITSSA~ 1 15 CD160 5 87.5 #> 4 db_CD1~ INITSSA~ 1 15 CD160 25 93.2 #> 5 db_CD1~ INITSSA~ 1 15 CD160 120 95.5 #> # ... with 8 more variables: err_frac_exch_state <dbl>, #> # abs_frac_exch_state <dbl>, err_abs_frac_exch_state <dbl>, #> # avg_theo_in_time <dbl>, err_avg_theo_in_time <dbl>, #> # abs_avg_theo_in_time <dbl>, err_abs_avg_theo_in_time <dbl>, #> # Med_Sequence <dbl># calculate data for the sequence INITSSASQEGTRLN in the CD160_HVEM state (kin2 <- calculate_kinetics(dat, protein = "db_CD160", sequence = "INITSSASQEGTRLN", state = "CD160_HVEM", start = 1, end = 15, time_in = 0.001, time_out = 1440))#> # A tibble: 5 x 15 #> Protein Sequence Start End State time_chosen frac_exch_state #> <chr> <chr> <int> <int> <chr> <dbl> <dbl> #> 1 db_CD1~ INITSSA~ 1 15 CD16~ 0.167 74.4 #> 2 db_CD1~ INITSSA~ 1 15 CD16~ 1 81.5 #> 3 db_CD1~ INITSSA~ 1 15 CD16~ 5 82.9 #> 4 db_CD1~ INITSSA~ 1 15 CD16~ 25 87.7 #> 5 db_CD1~ INITSSA~ 1 15 CD16~ 120 95.2 #> # ... with 8 more variables: err_frac_exch_state <dbl>, #> # abs_frac_exch_state <dbl>, err_abs_frac_exch_state <dbl>, #> # avg_theo_in_time <dbl>, err_avg_theo_in_time <dbl>, #> # abs_avg_theo_in_time <dbl>, err_abs_avg_theo_in_time <dbl>, #> # Med_Sequence <dbl># load extra packages library(dplyr) # plot a single peptide - theoretical and relative plot_kinetics(kin_dat = kin1, theoretical = TRUE, relative = TRUE)# plot joined data - experimental and absolute bind_rows(kin1, kin2) %>% plot_kinetics(theoretical = FALSE, relative = FALSE)