Plot comparison plot
comparison_plot.RdProduces comparison_plot based on previously processed data - theoretical or experimental. User can change labels if needed.
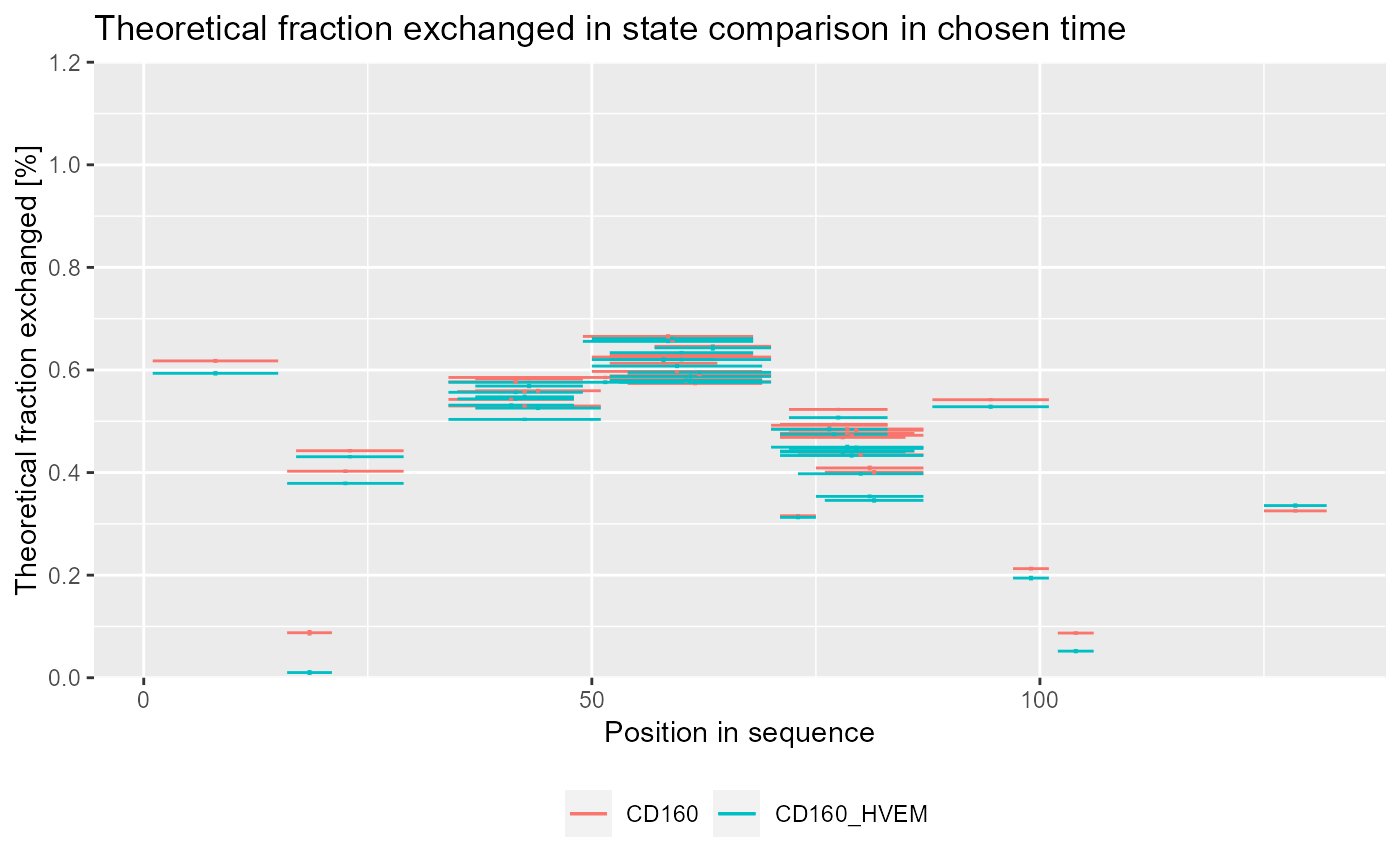
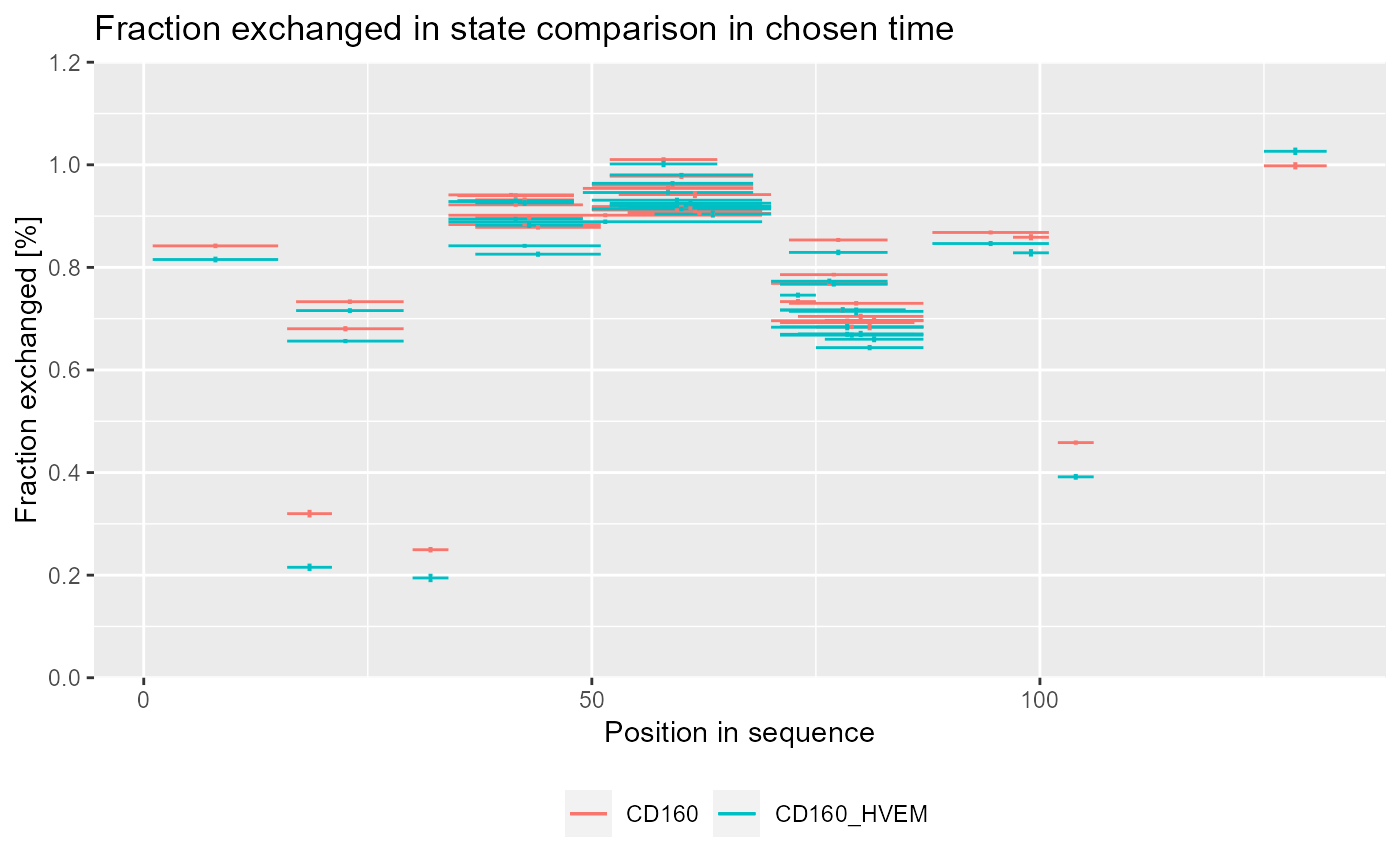
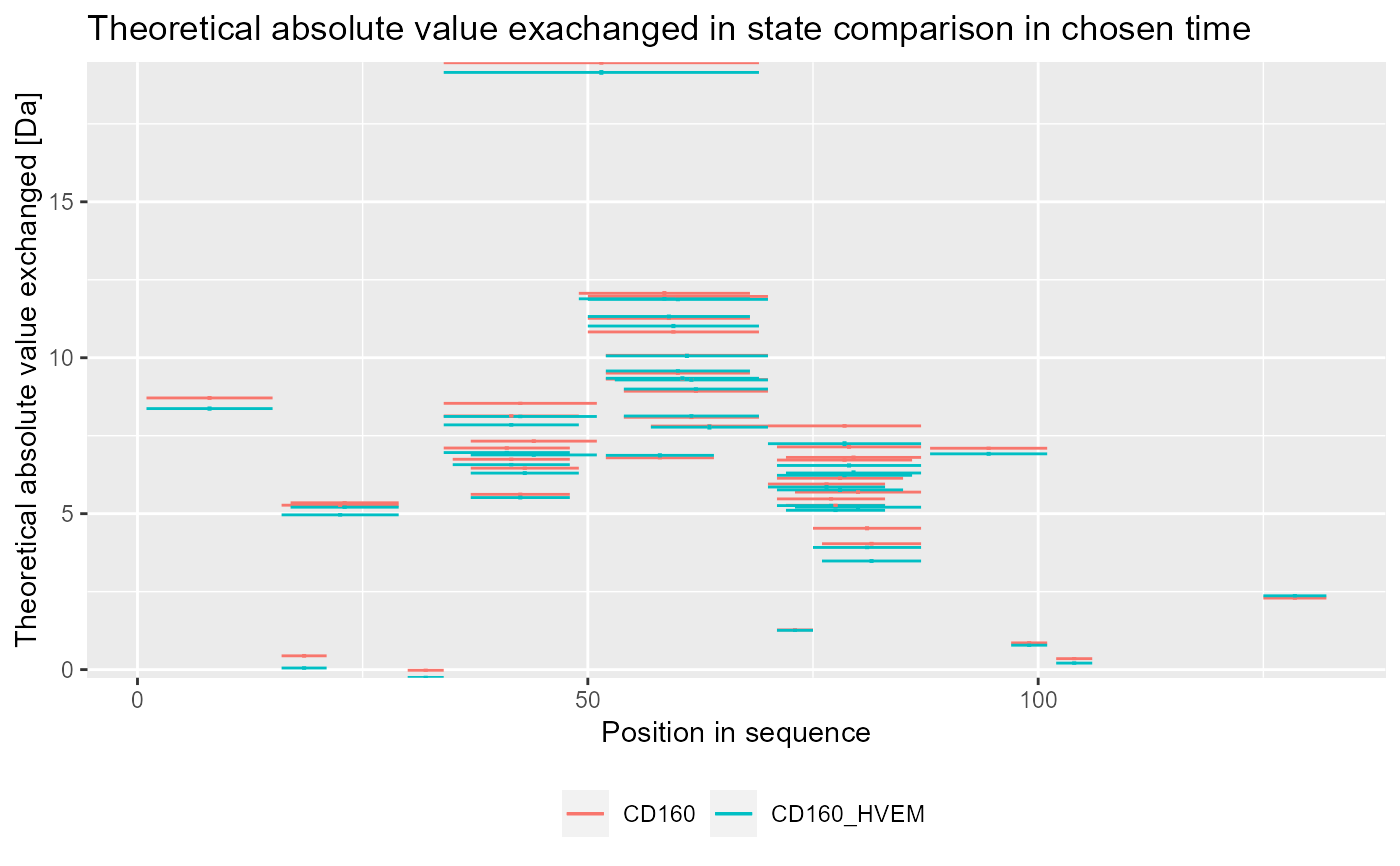
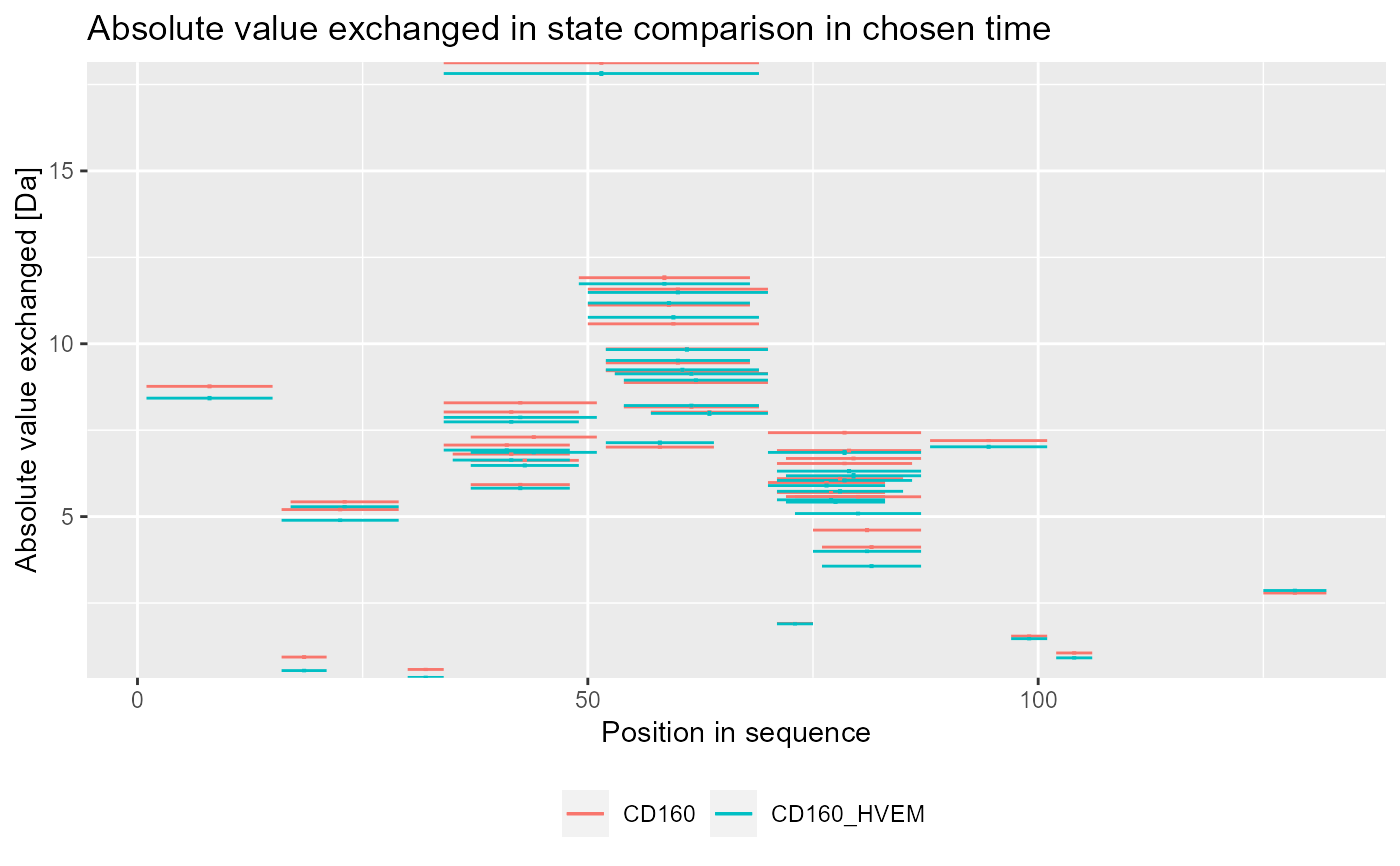
comparison_plot(
  calc_dat,
  theoretical = FALSE,
  relative = TRUE,
  state_first = "state_first",
  state_second = "state_second"
)
Arguments
| calc_dat | processed data from DynamX file - using prepare_dataset |
|---|---|
| theoretical | logical value to determine if plot is theoretical or not. default : false |
| relative | logical value to determine if values are relative or absolute. default : true |
| state_first | first state name |
| state_second | second state name |
Value
a ggplot object.
Details
...
This is the first version - multi-state calculations are not supported.
See also
Examples
# load example data dat <- read_hdx(system.file(package = "HaDeX", "HaDeX/data/KD_180110_CD160_HVEM.csv")) # prepare dataset for states `CD160` and `CD160_HVEM` in given time parameters calc_dat <- prepare_dataset(dat, in_state_first = "CD160_0.001", chosen_state_first = "CD160_1", out_state_first = "CD160_1440", in_state_second = "CD160_HVEM_0.001", chosen_state_second = "CD160_HVEM_1", out_state_second = "CD160_HVEM_1440") # plot comparison plot - theoretical & relative comparison_plot(calc_dat = calc_dat, theoretical = TRUE, relative = TRUE, state_first = "CD160", state_second = "CD160_HVEM")#> Warning: Removed 1 rows containing missing values (geom_segment).#> Warning: Removed 1 rows containing missing values (geom_segment).# plot comparison plot - experimental & relative comparison_plot(calc_dat = calc_dat, theoretical = FALSE, relative = TRUE, state_first = "CD160", state_second = "CD160_HVEM")# plot comparison plot - theoretical & absolute comparison_plot(calc_dat = calc_dat, theoretical = TRUE, relative = FALSE, state_first = "CD160", state_second = "CD160_HVEM")# plot comparison plot - experimental & absolute comparison_plot(calc_dat = calc_dat, theoretical = FALSE, relative = FALSE, state_first = "CD160", state_second = "CD160_HVEM")